SecStrAnnotator:Analysis: Difference between revisions
No edit summary |
No edit summary |
||
| (22 intermediate revisions by the same user not shown) | |||
| Line 1: | Line 1: | ||
SecStrAnnotator Suite provides scripts (Python, R | SecStrAnnotator Suite provides scripts (Python, R) for batch annotation of the whole family and analysis of the annotation results. | ||
==Procedure== | |||
===Data preparation=== | |||
The directory <code>scripts/secstrapi_data_preparation/</code> contains a pipeline for annotating the whole protein family, including: | |||
* downloading the list of family members defined by CATH and Pfam, | |||
* downloading their structures, | |||
* selecting a non-redundant set, | |||
* annotation, | |||
* multiple sequence alignment for individual SSEs, | |||
* formatting into [[SecStrAnnotator:SecStrAPI#SecStrAPI_format | SecStrAPI format]], | |||
* formatting into TSV format for further analyses. | |||
The whole pipeline can be executed by <code>scripts/SecStrAPI_pipeline.py</code> | |||
Example usage: | |||
python3 scripts/SecStrAPI_pipeline.py scripts/SecStrAPI_pipeline_settings.json --resume | |||
Before running, modify the settings in <code>SecStrAPI_pipeline_settings.json</code> to set your family of interest, annotation template, data directory etc (see <code>README.txt</code> for more details). | |||
===Data analysis=== | |||
The directory <code>scripts/R_sec_str_anatomy_analysis/</code> contains a pipeline for statistical analysis of the annotation results on the whole protein family, including: | |||
* reading the annotation results from TSV, | |||
* generating plots, | |||
* performing statistical test to compare eukaryotic and bacterial structures (or any two sets of structures). | |||
Example usage: | |||
* Launch <code>rstudio</code> from the said directory | |||
* In <code>sec_str_anatomy.R</code>, set DATADIR to the path to your annotation data created in [[#Data preparation]] | |||
* In <code>sec_str_anatomy_settings.R</code>, modify the family-specific settings (list of helices and strands) | |||
* Run <code>sec_str_anatomy.R</code> line by line | |||
==Example case study: Cytochromes P450== | ==Example case study: Cytochromes P450== | ||
| Line 10: | Line 42: | ||
===Data=== | ===Data=== | ||
For the Cytochrome P450 family, structures of | For the Cytochrome P450 family, structures of 1855 protein domains are available, located in 1012 PDB entries (updated on 7 July 2020). The analysis was performed on a non-redundant subset containing 183 protein domains. | ||
The data are available [https://doi.org/10.5281/zenodo.3939133 here] (structural files not included because of their size). | |||
===Occurrence of SSEs=== | ===Occurrence of SSEs=== | ||
| Line 17: | Line 50: | ||
The ''occurrence'' describes in what percentage of the structures a particular SSE is present. | The ''occurrence'' describes in what percentage of the structures a particular SSE is present. | ||
<div><ul> | |||
<li style="display: inline-block;"> [[File:SecStrAnnotator-cyp-sse-occurrence.png | thumb | 500px | Occurrence of particular SSEs in the whole set.]] </li> | |||
<li style="display: inline-block;"> [[File:SecStrAnnotator-cyp-sse-occurrence-Bact-Euka.png | thumb | 500px | Occurrence of particular SSEs – comparison of bacterial and eukaryotic structures.]] </li> | |||
</ul></div> | |||
===Length of SSEs=== | ===Length of SSEs=== | ||
| Line 24: | Line 59: | ||
The ''length'' of an SSE is measured as the number of residues. The following violin plots show the distribution of length for each SSE. | The ''length'' of an SSE is measured as the number of residues. The following violin plots show the distribution of length for each SSE. | ||
<div><ul> | |||
<li style="display: inline-block;"> [[File:SecStrAnnotator-cyp-sse-length.png | thumb | 500px | Length distribution of particular SSEs in the whole set. ]] </li> | |||
<li style="display: inline-block;"> [[File:SecStrAnnotator-cyp-sse-length-Bact-Euka.png | thumb | 500px | Length distribution of particular SSEs – comparison of bacterial and eukaryotic structures. ]] </li> | |||
</ul></div> | |||
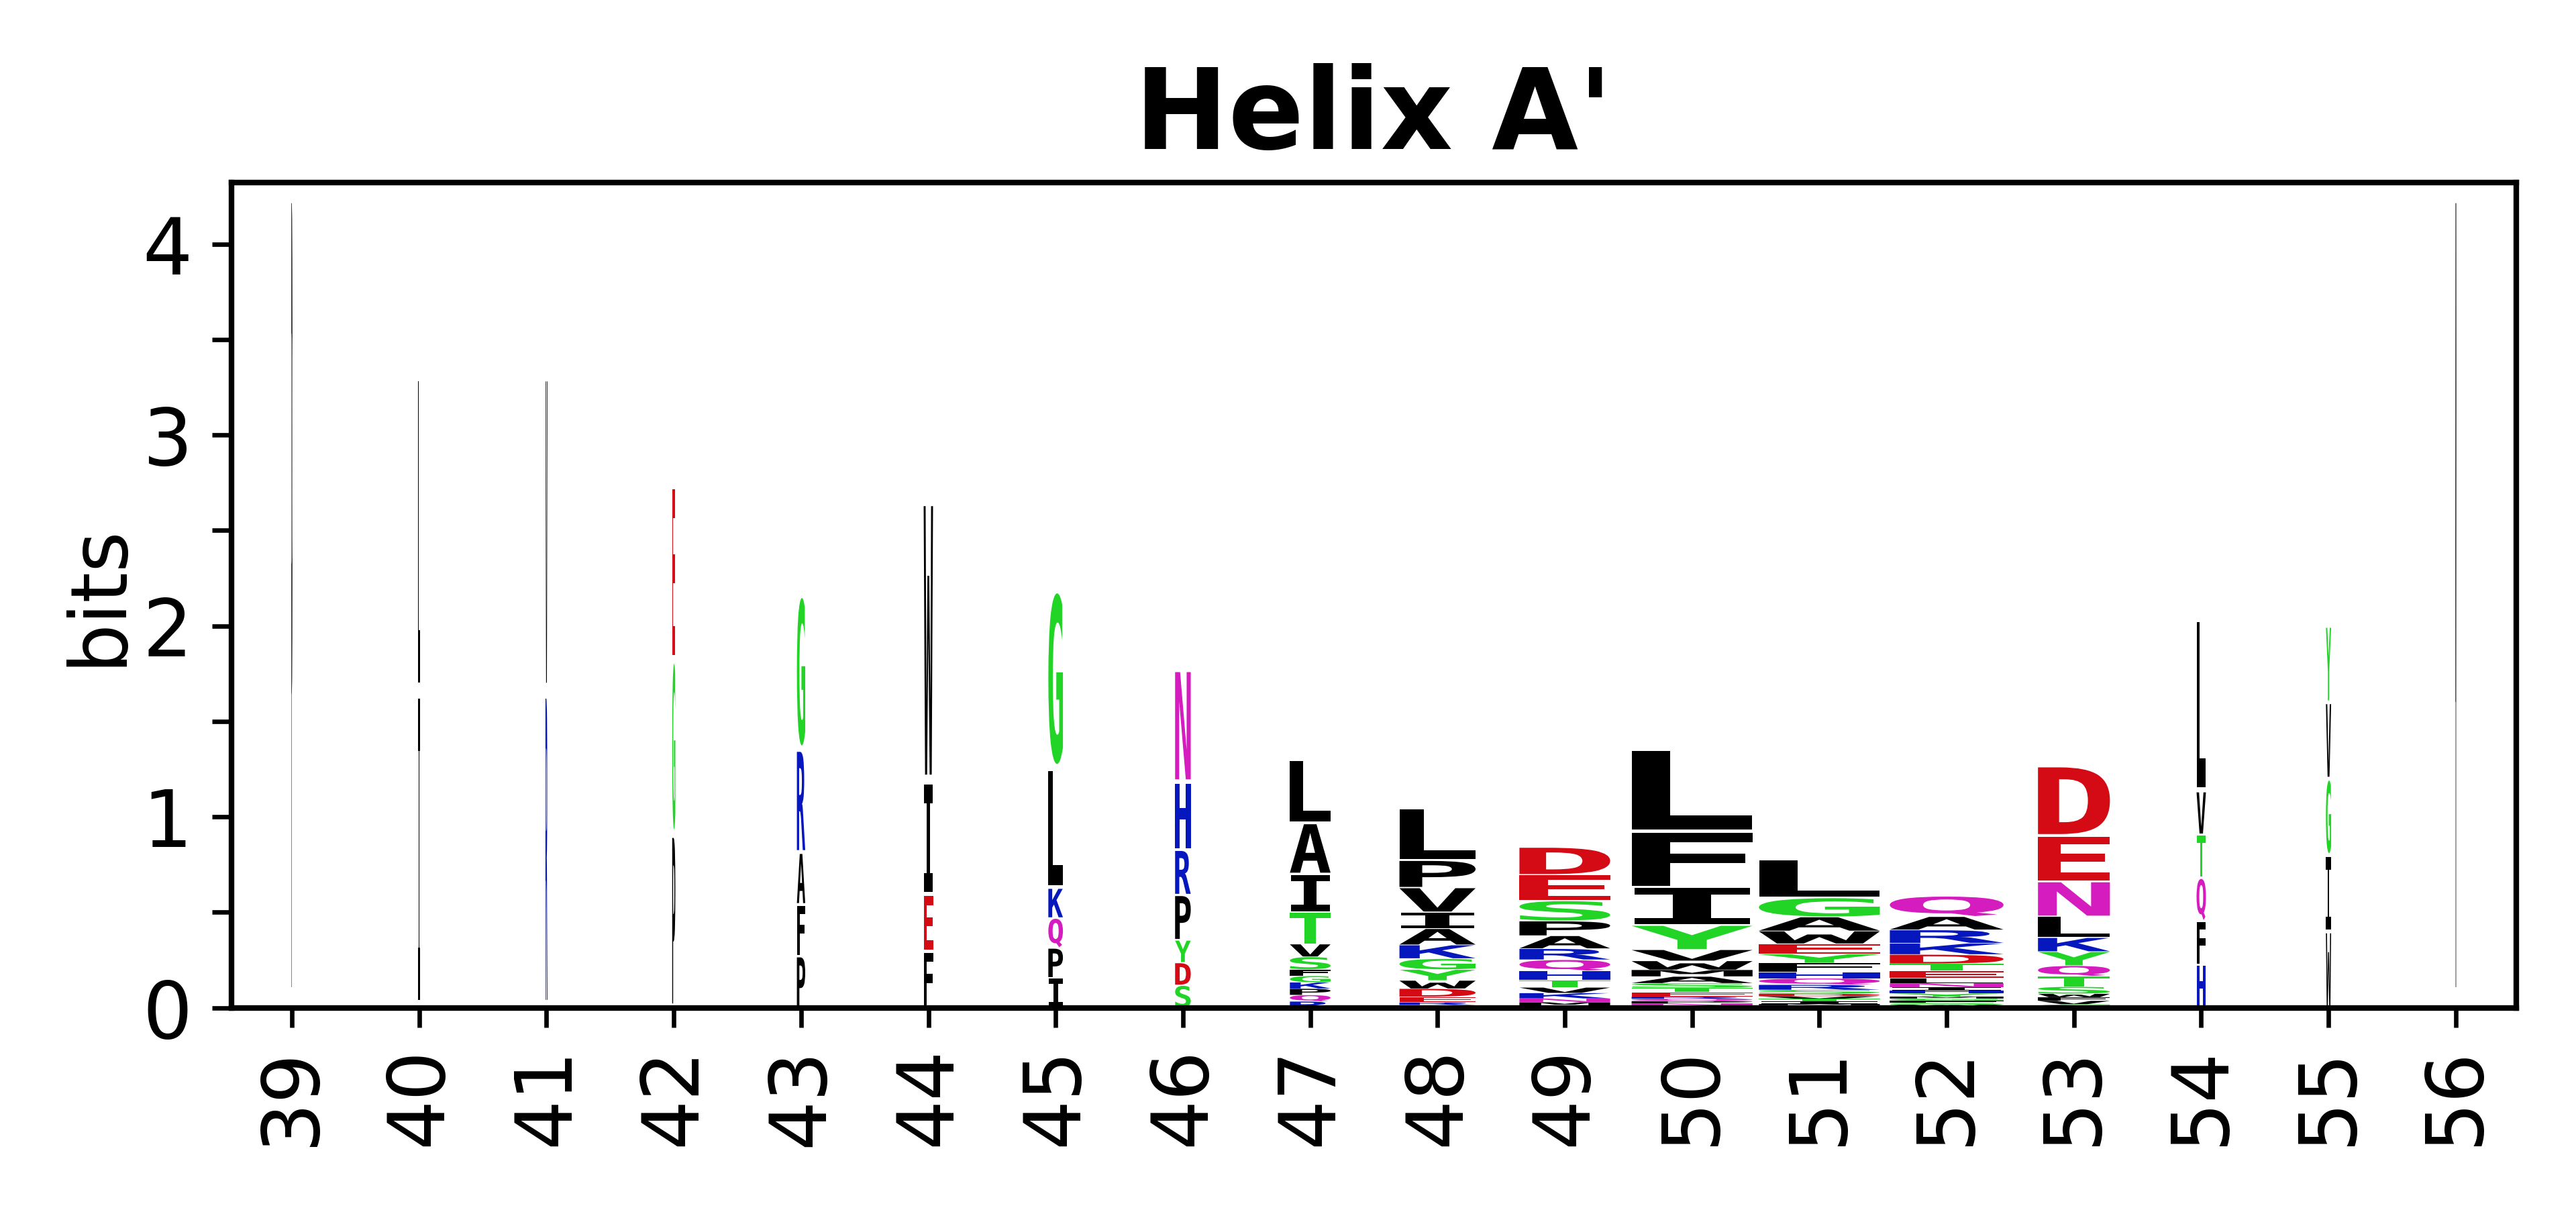
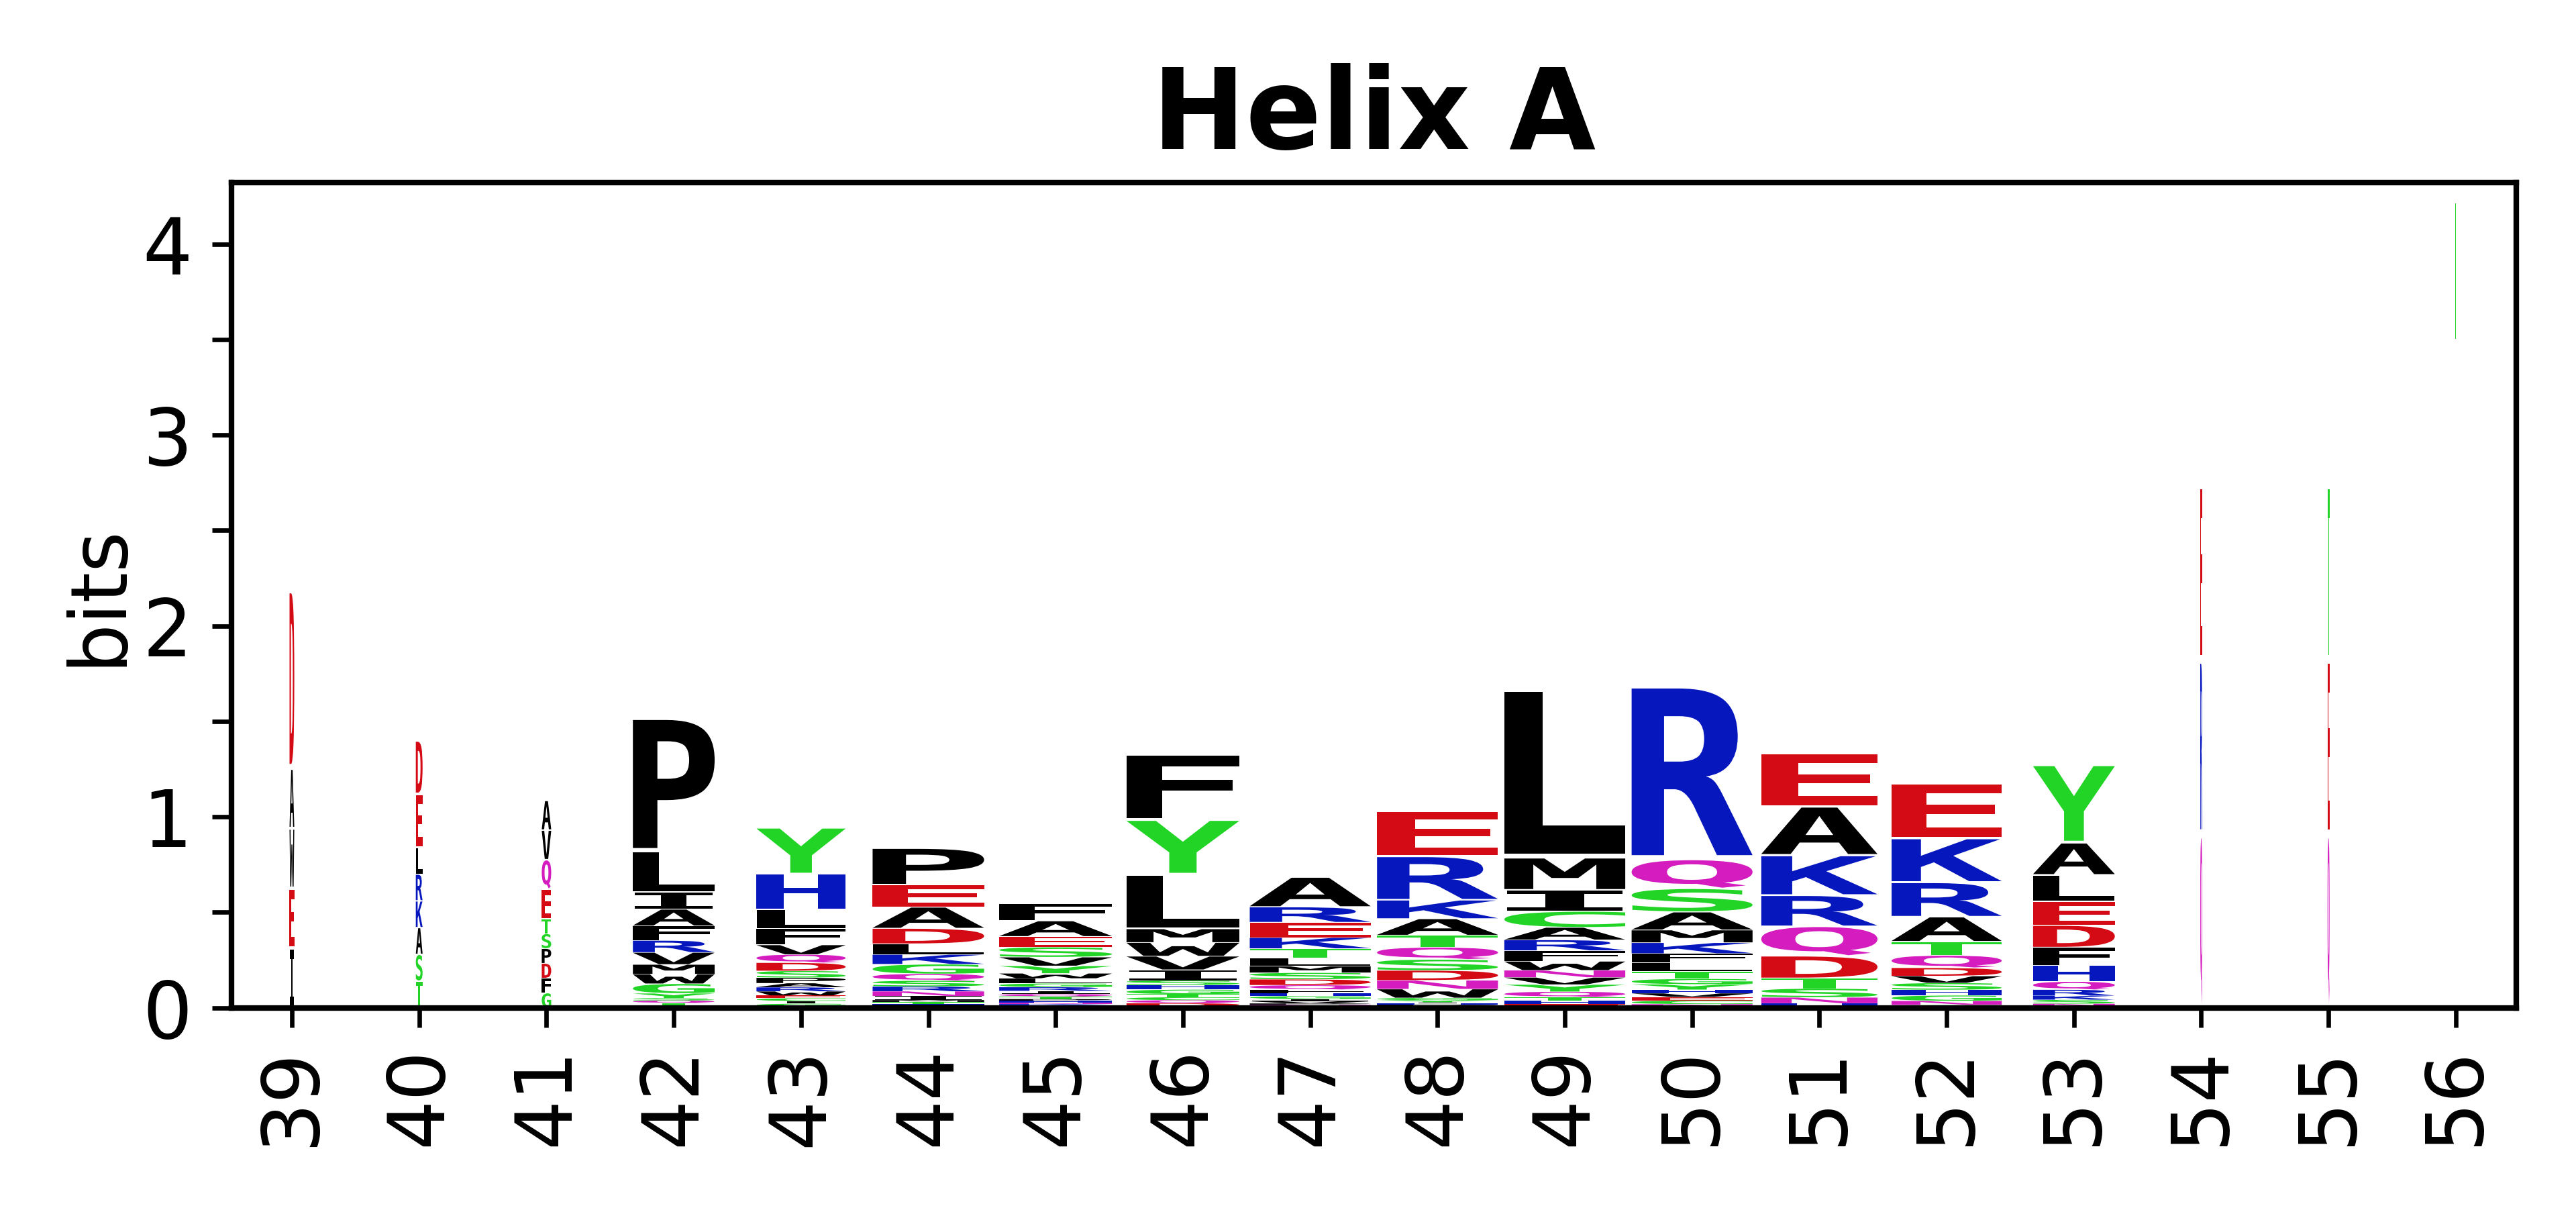
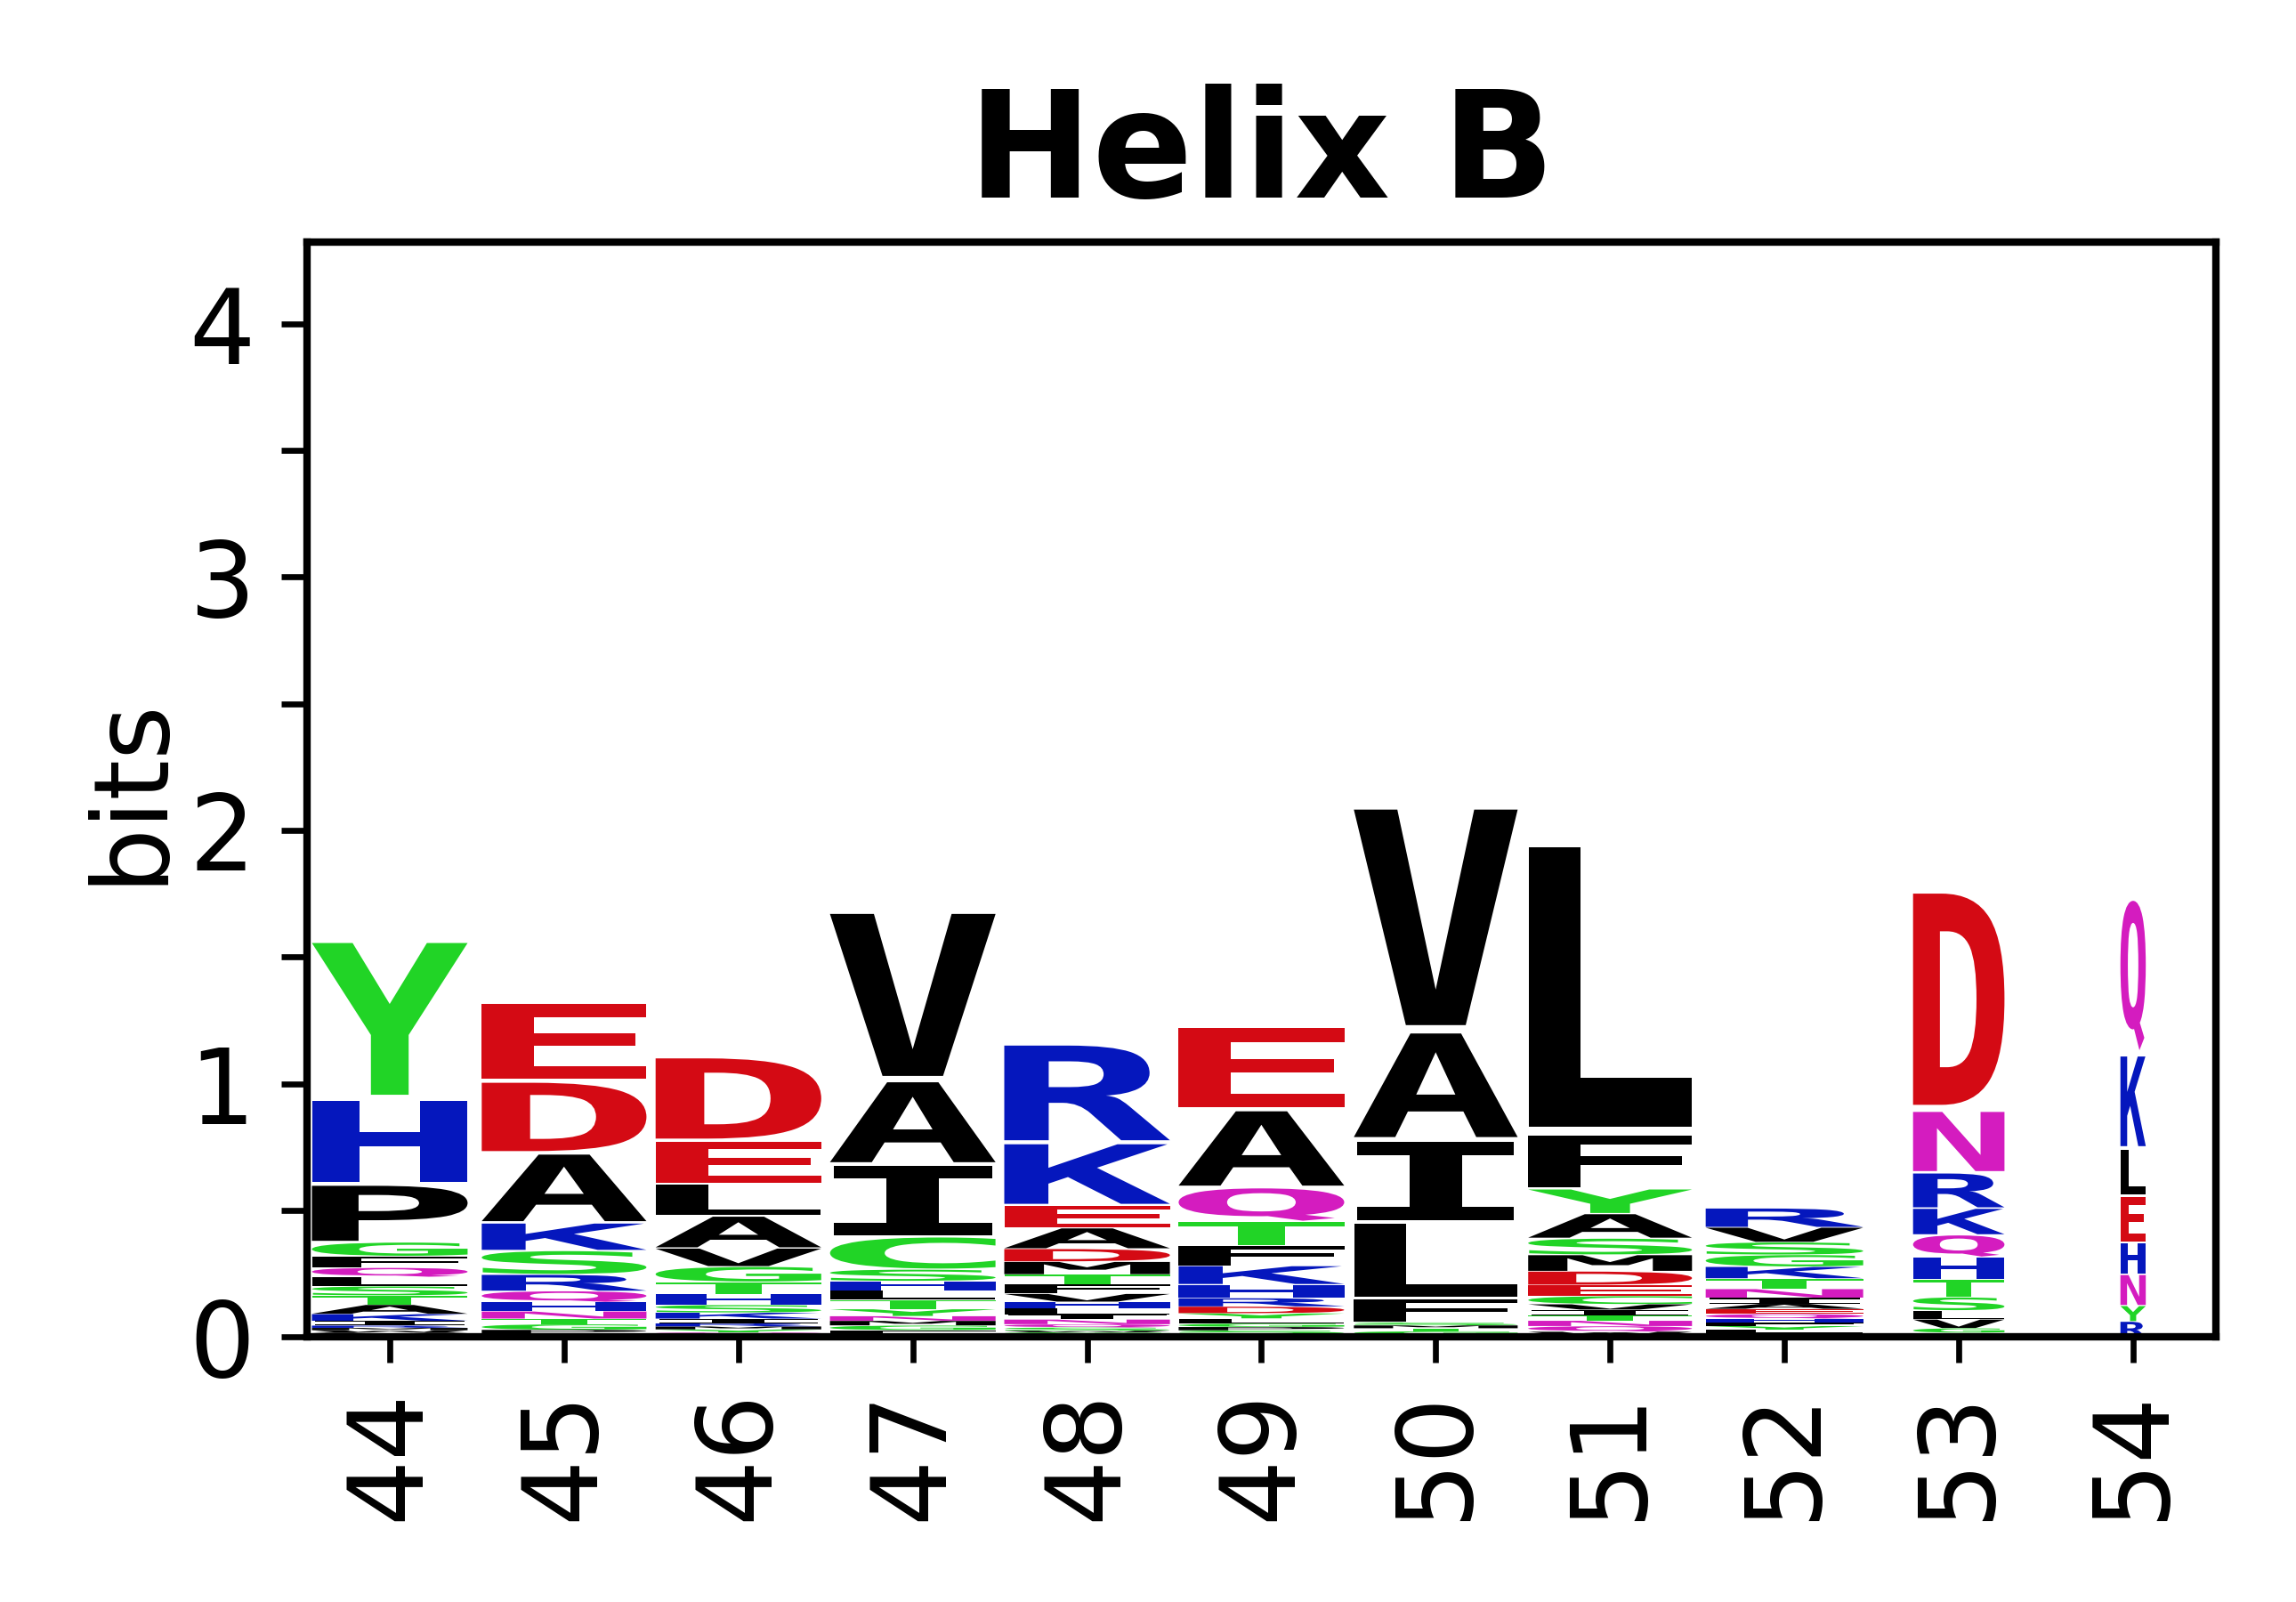
===Sequence of SSEs=== | ===Sequence of SSEs=== | ||
| Line 31: | Line 68: | ||
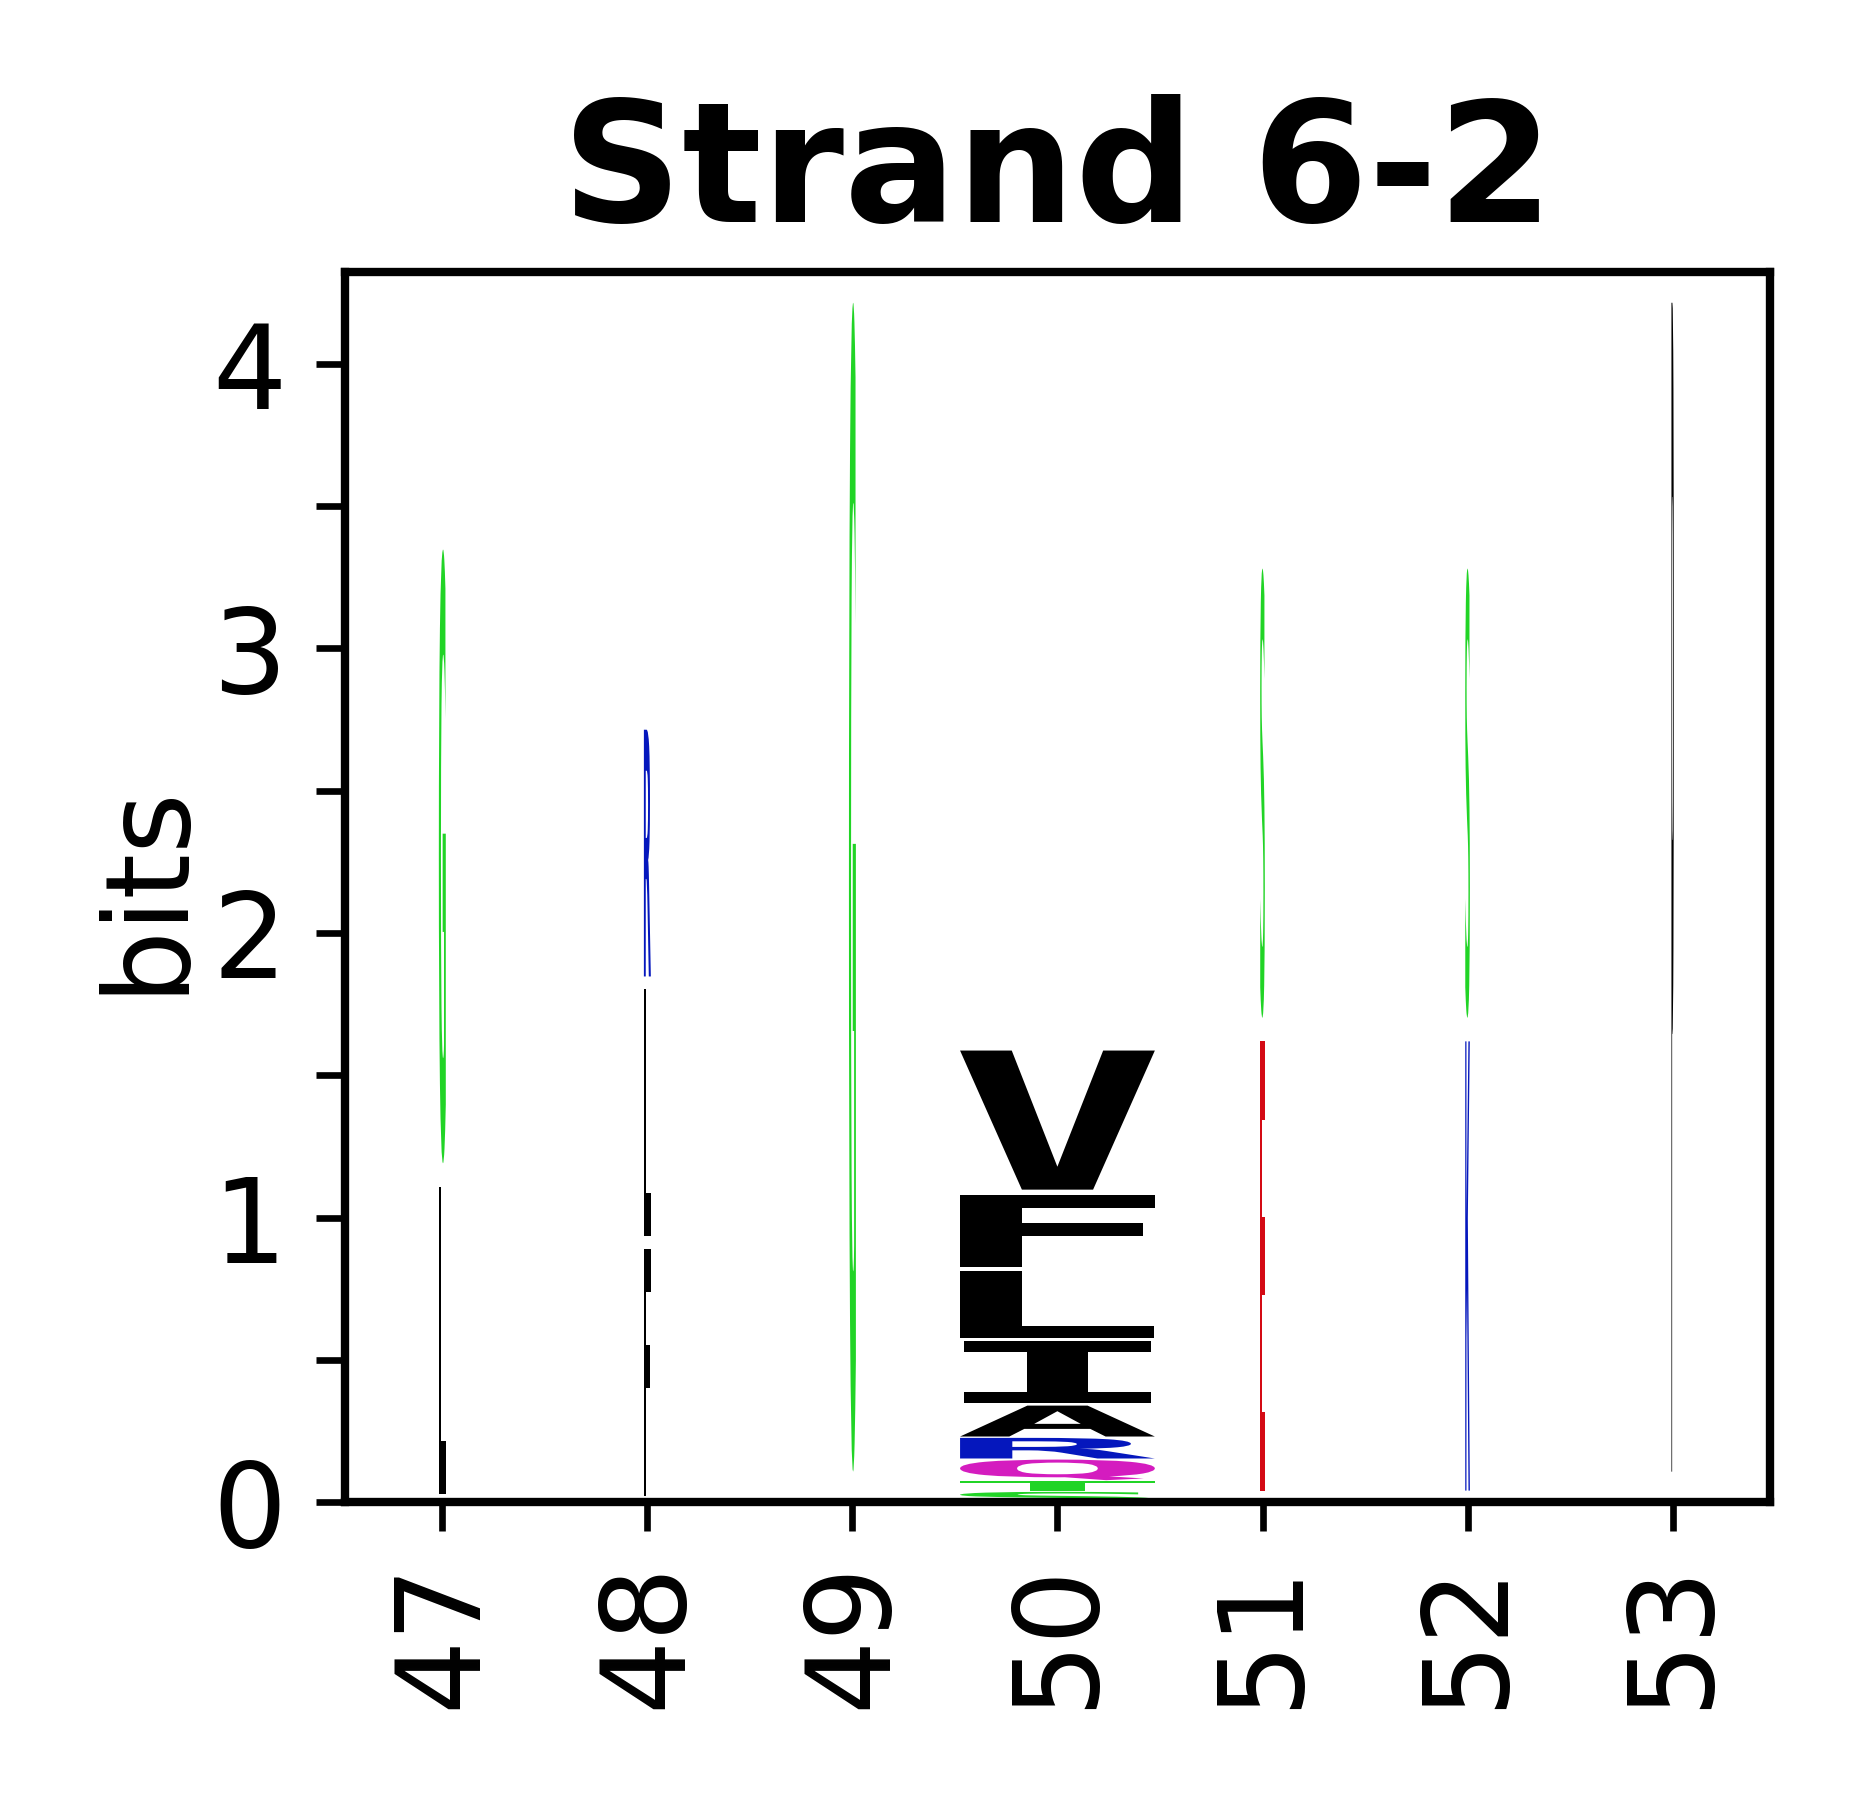
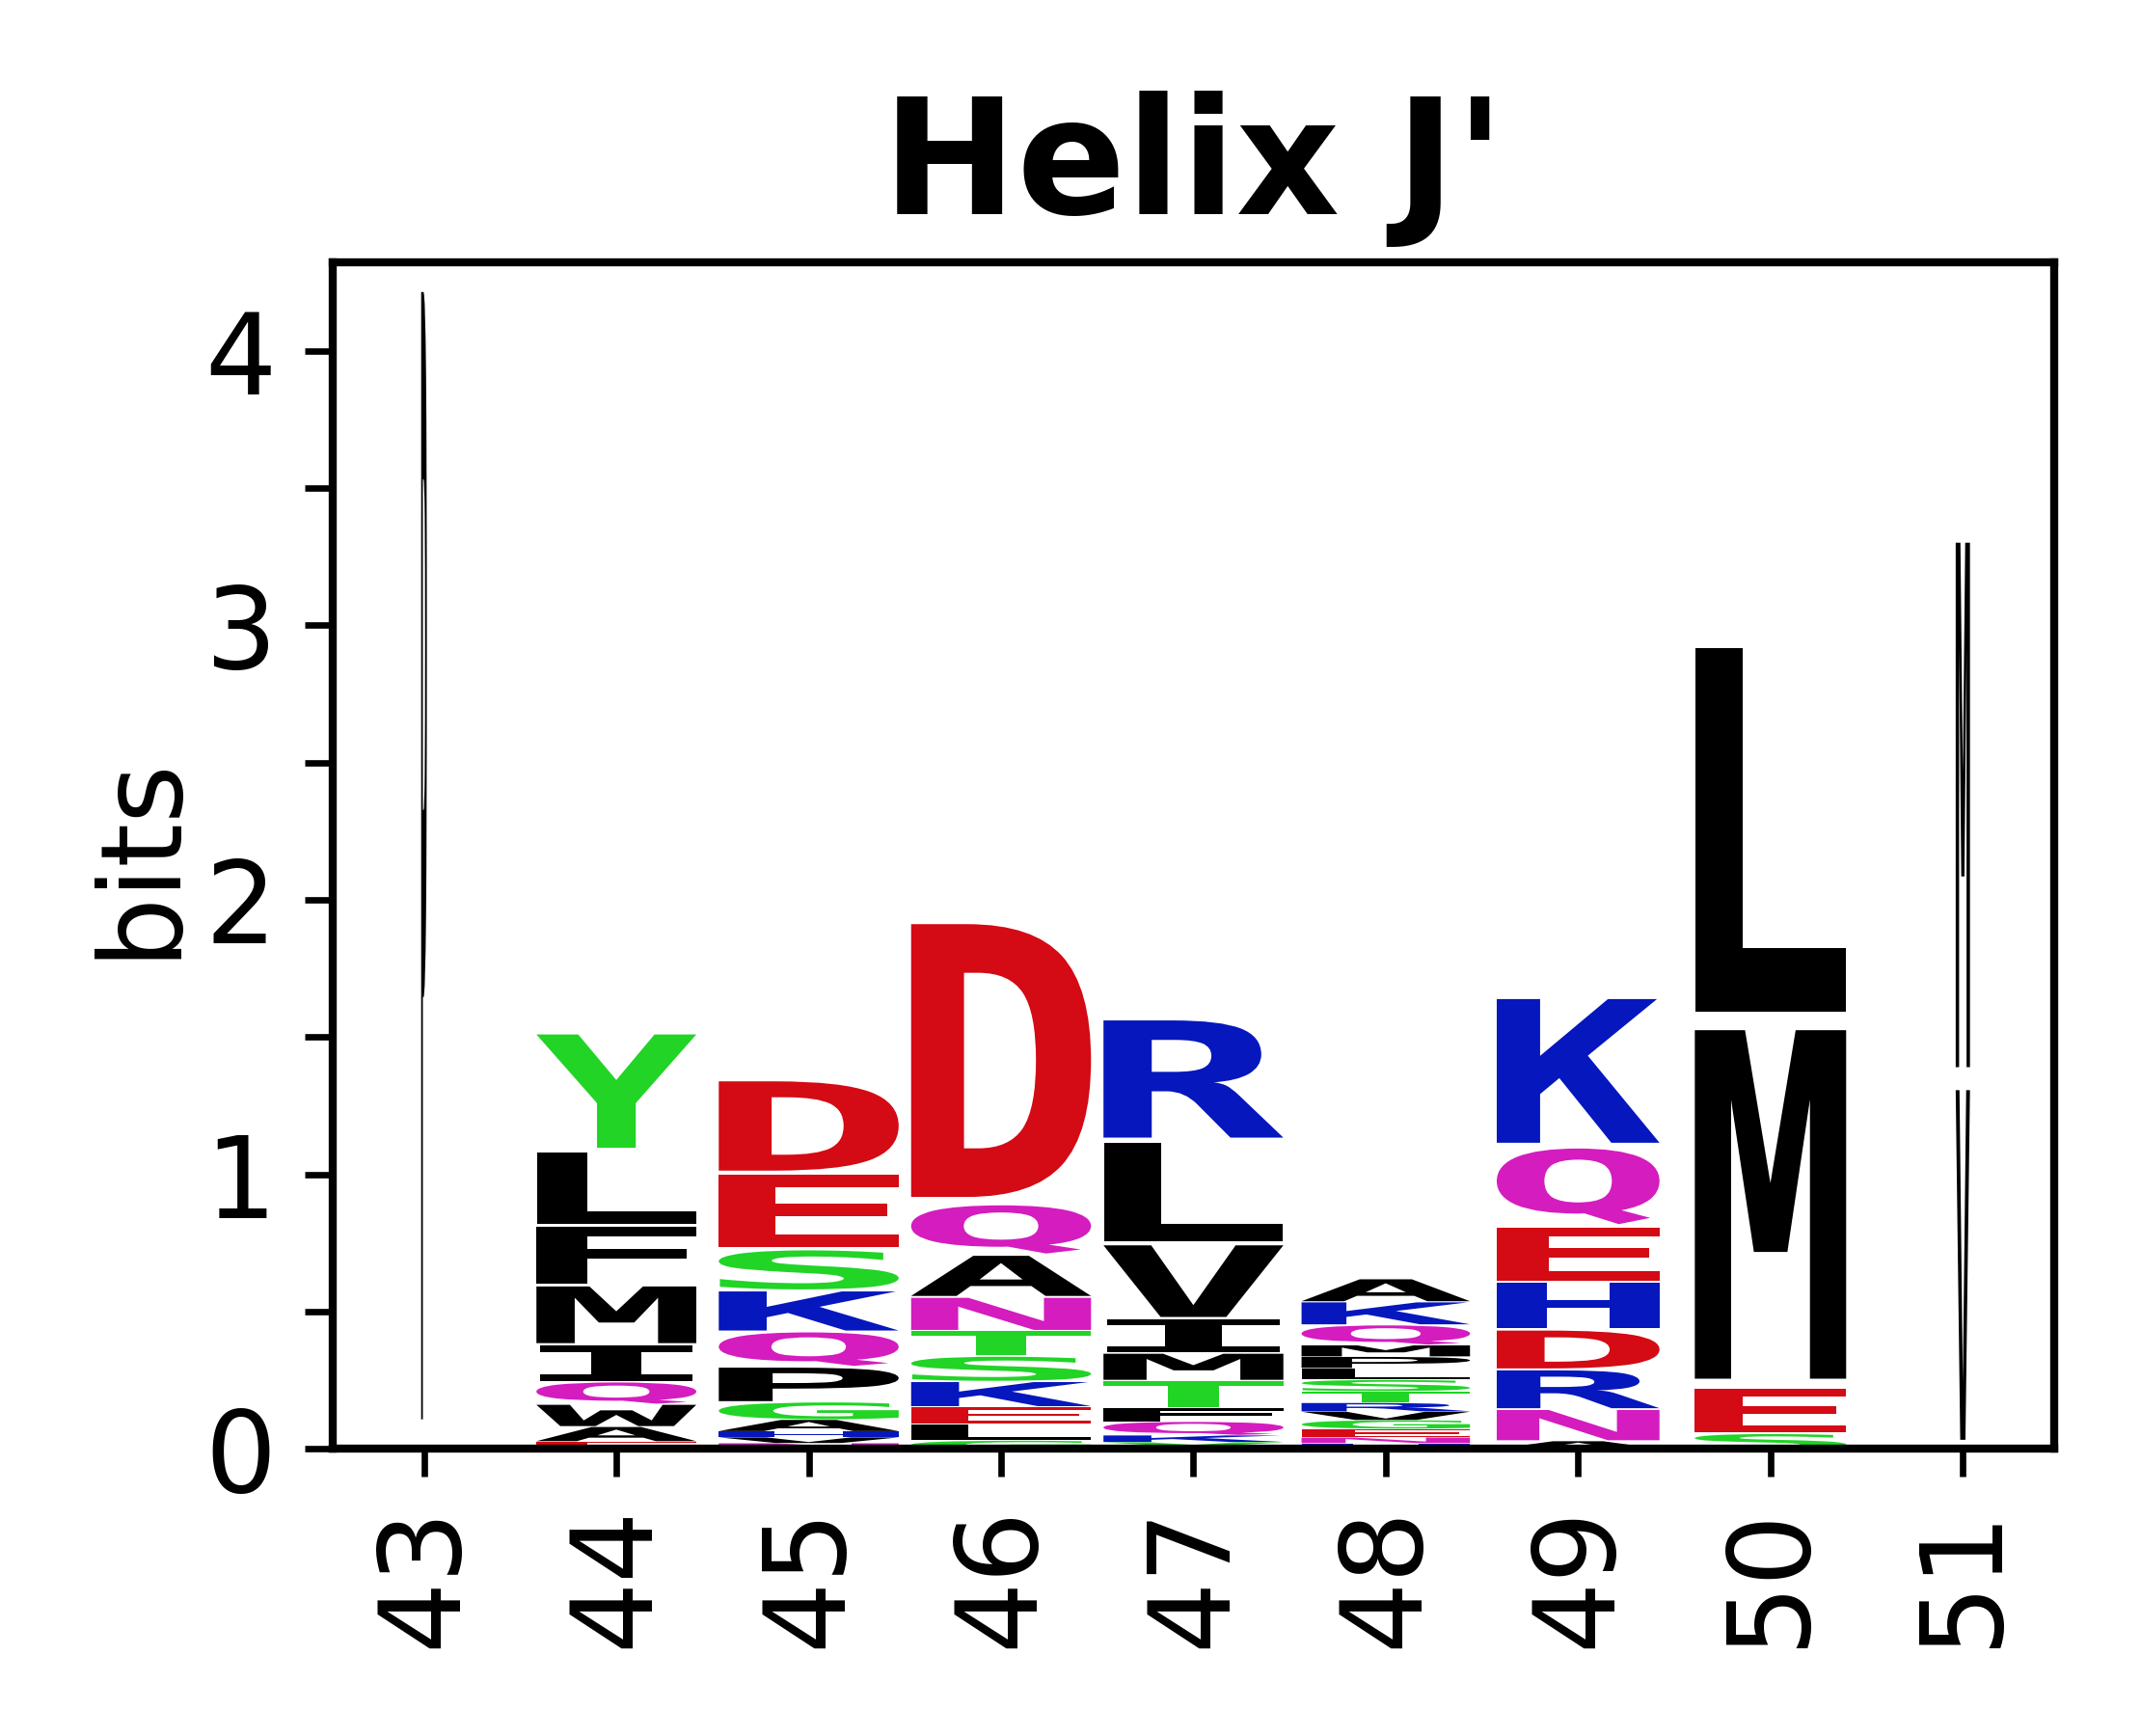
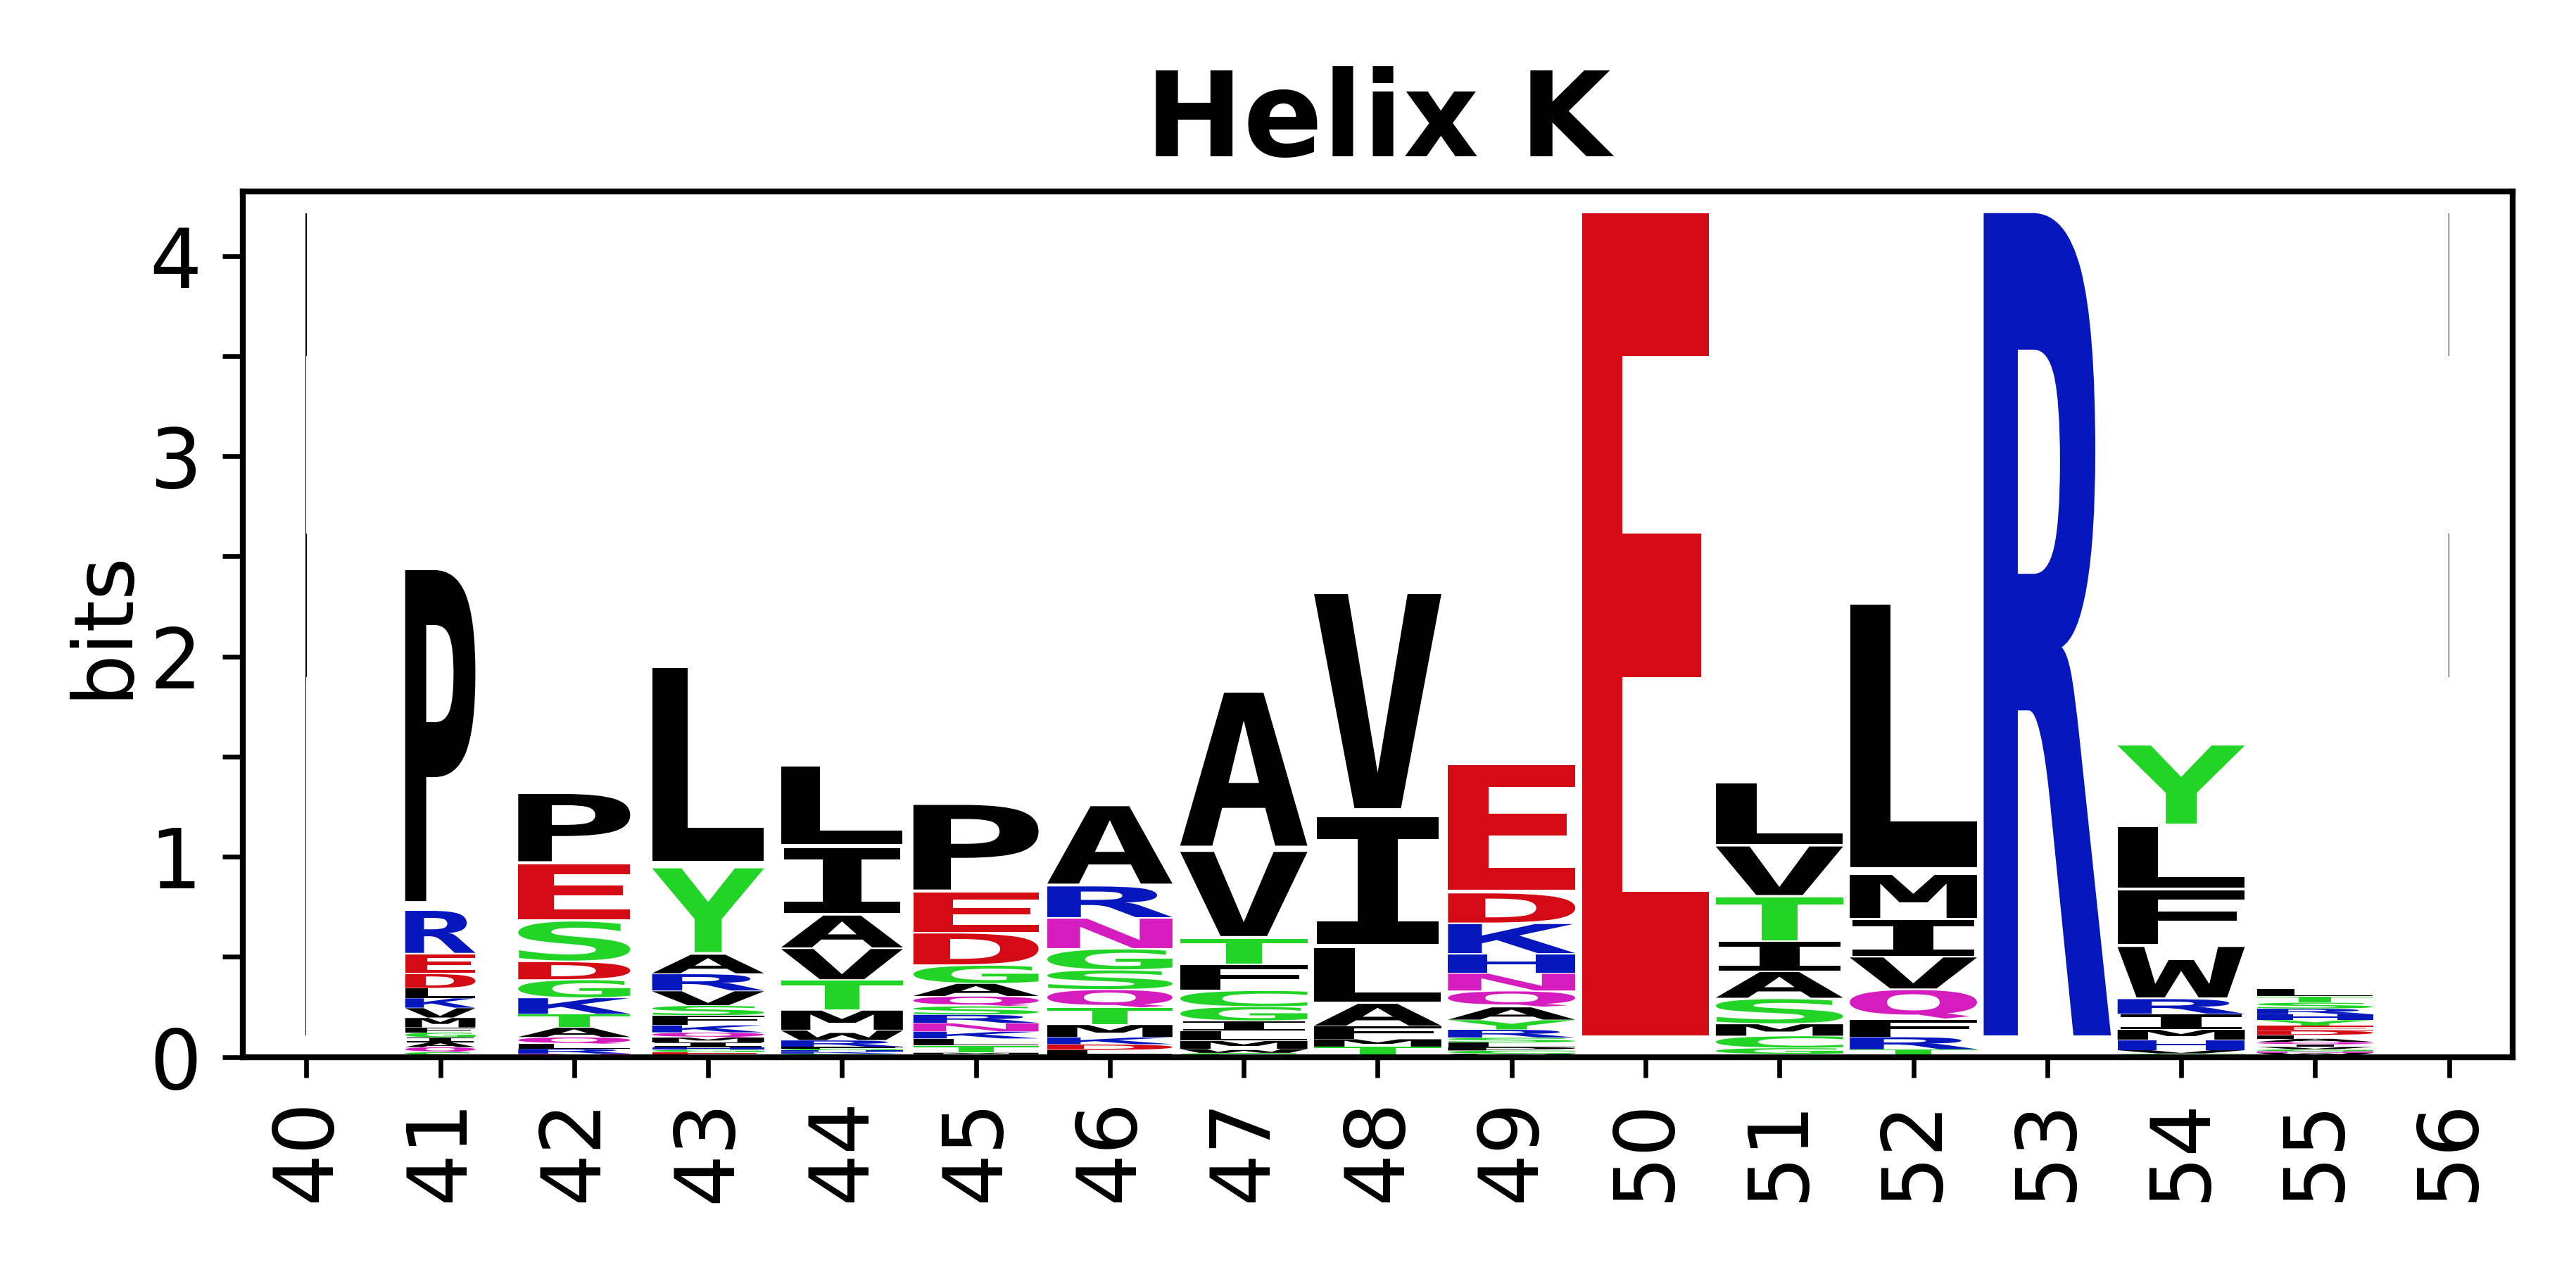
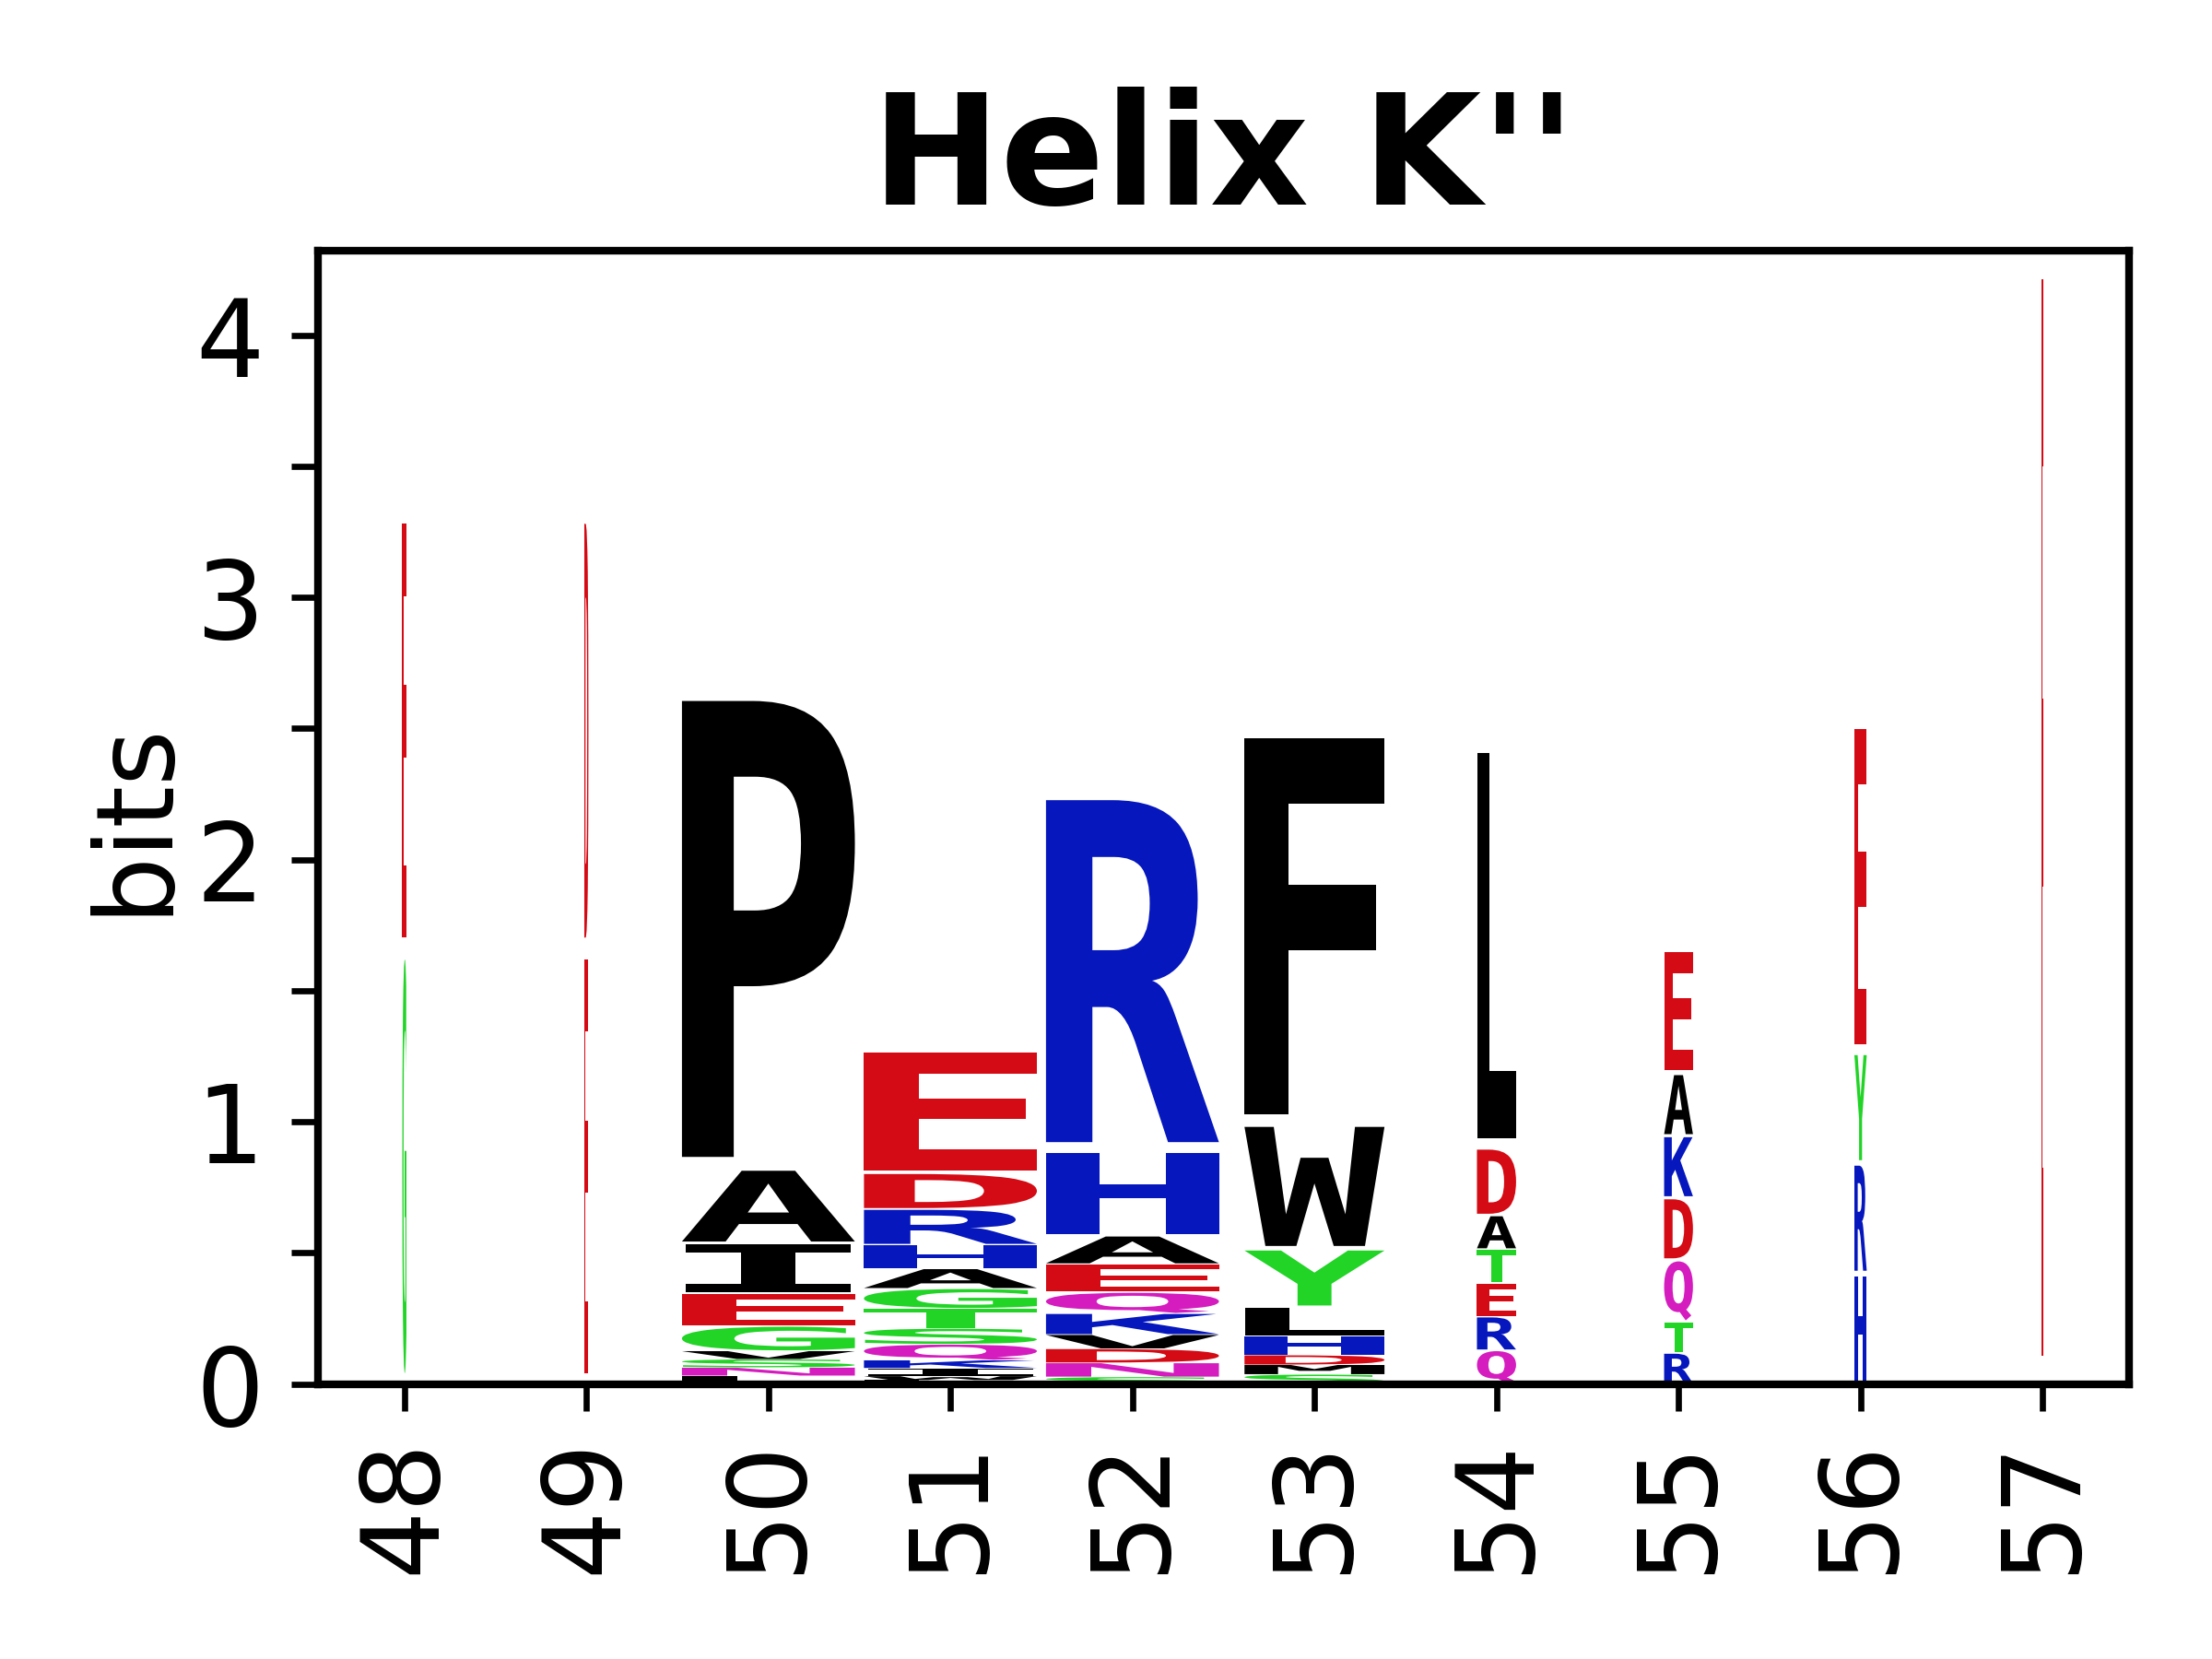
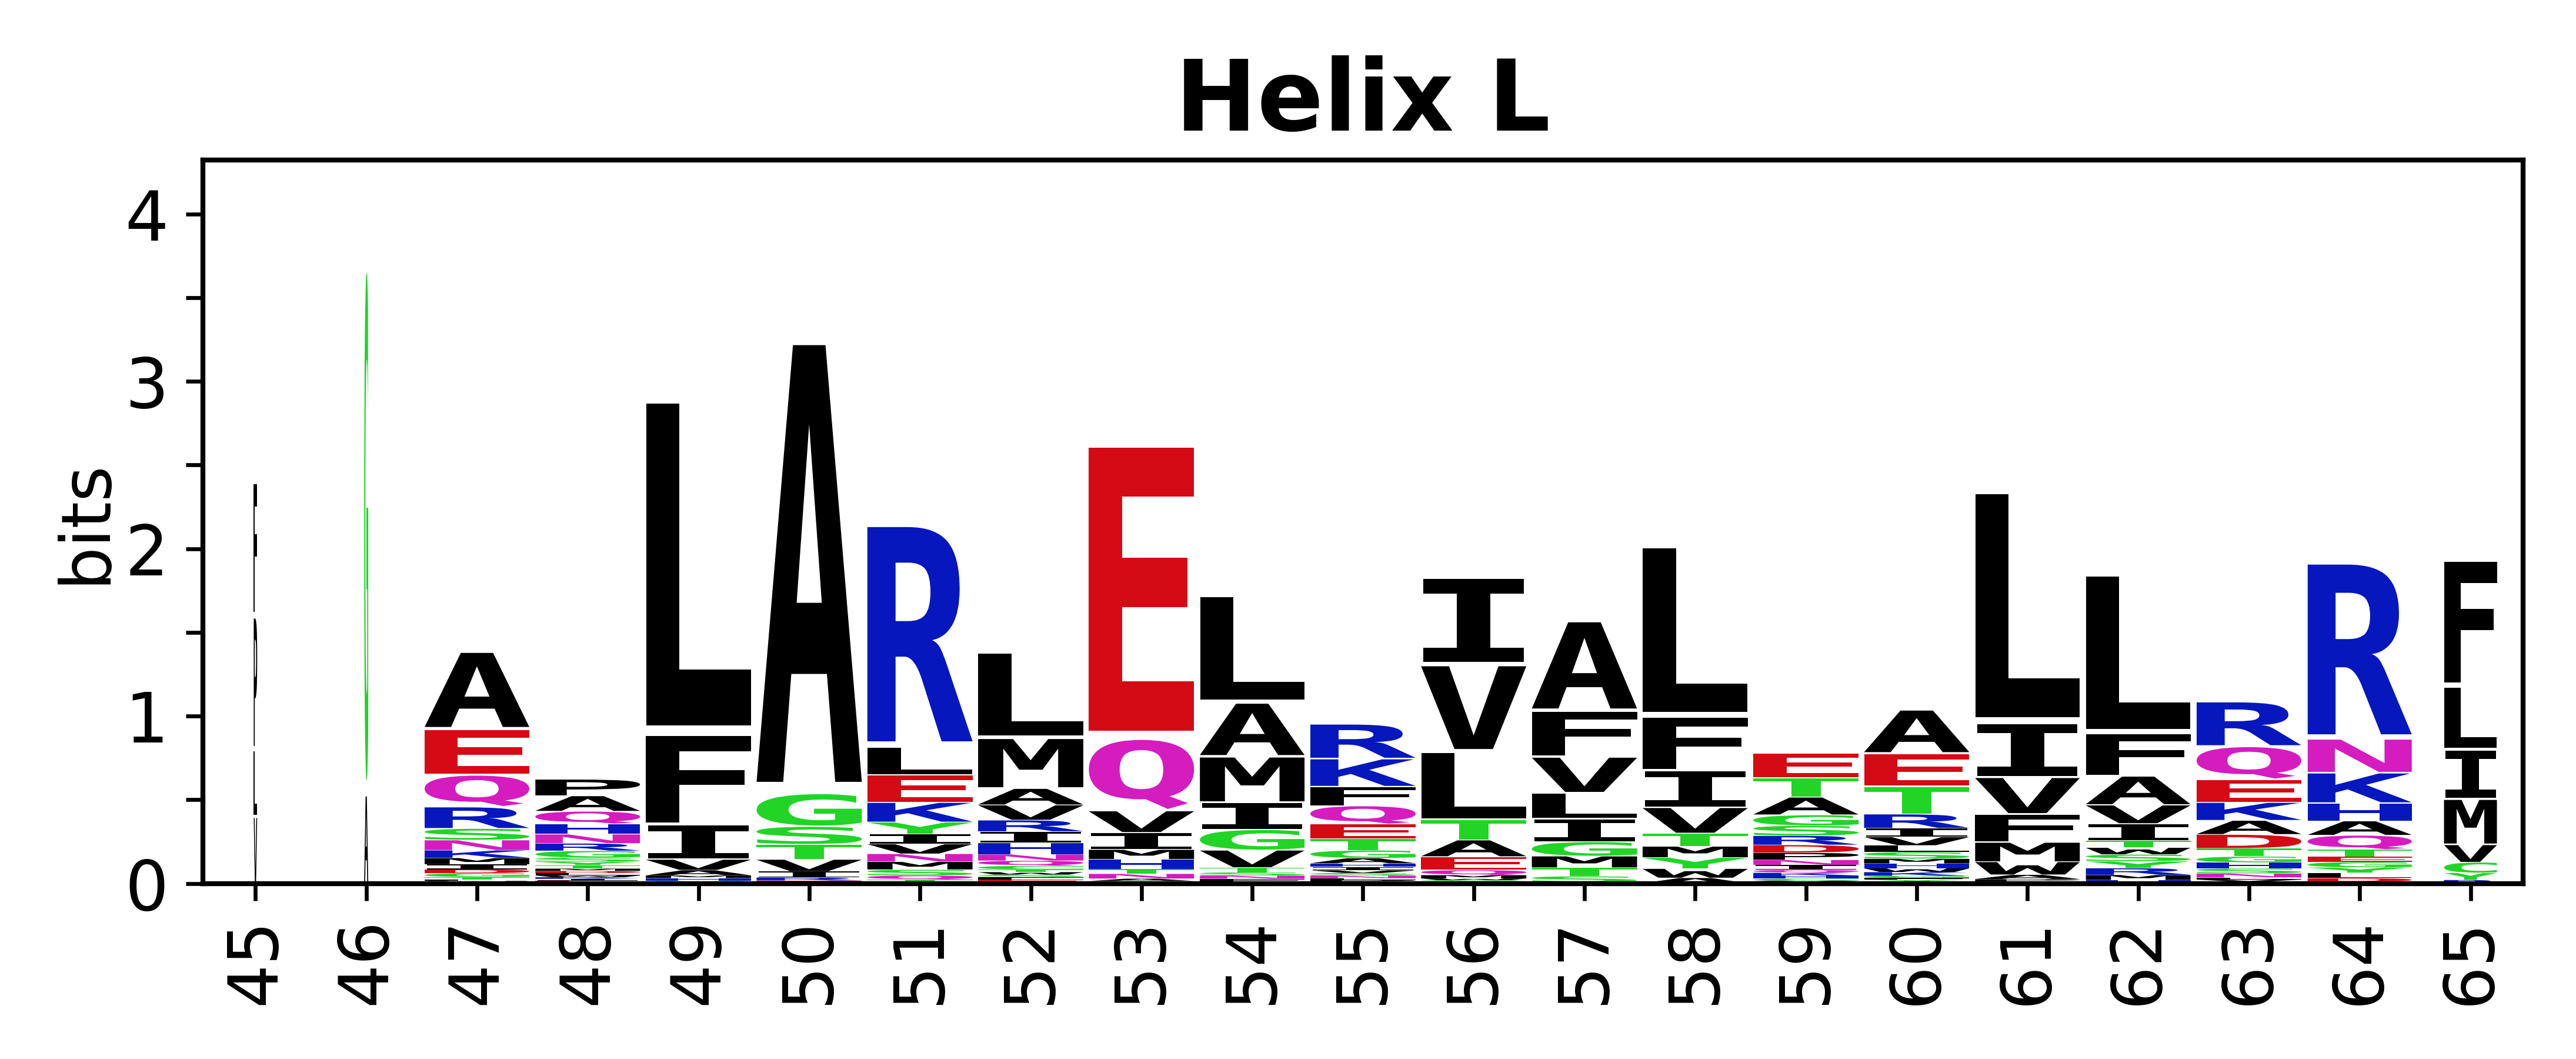
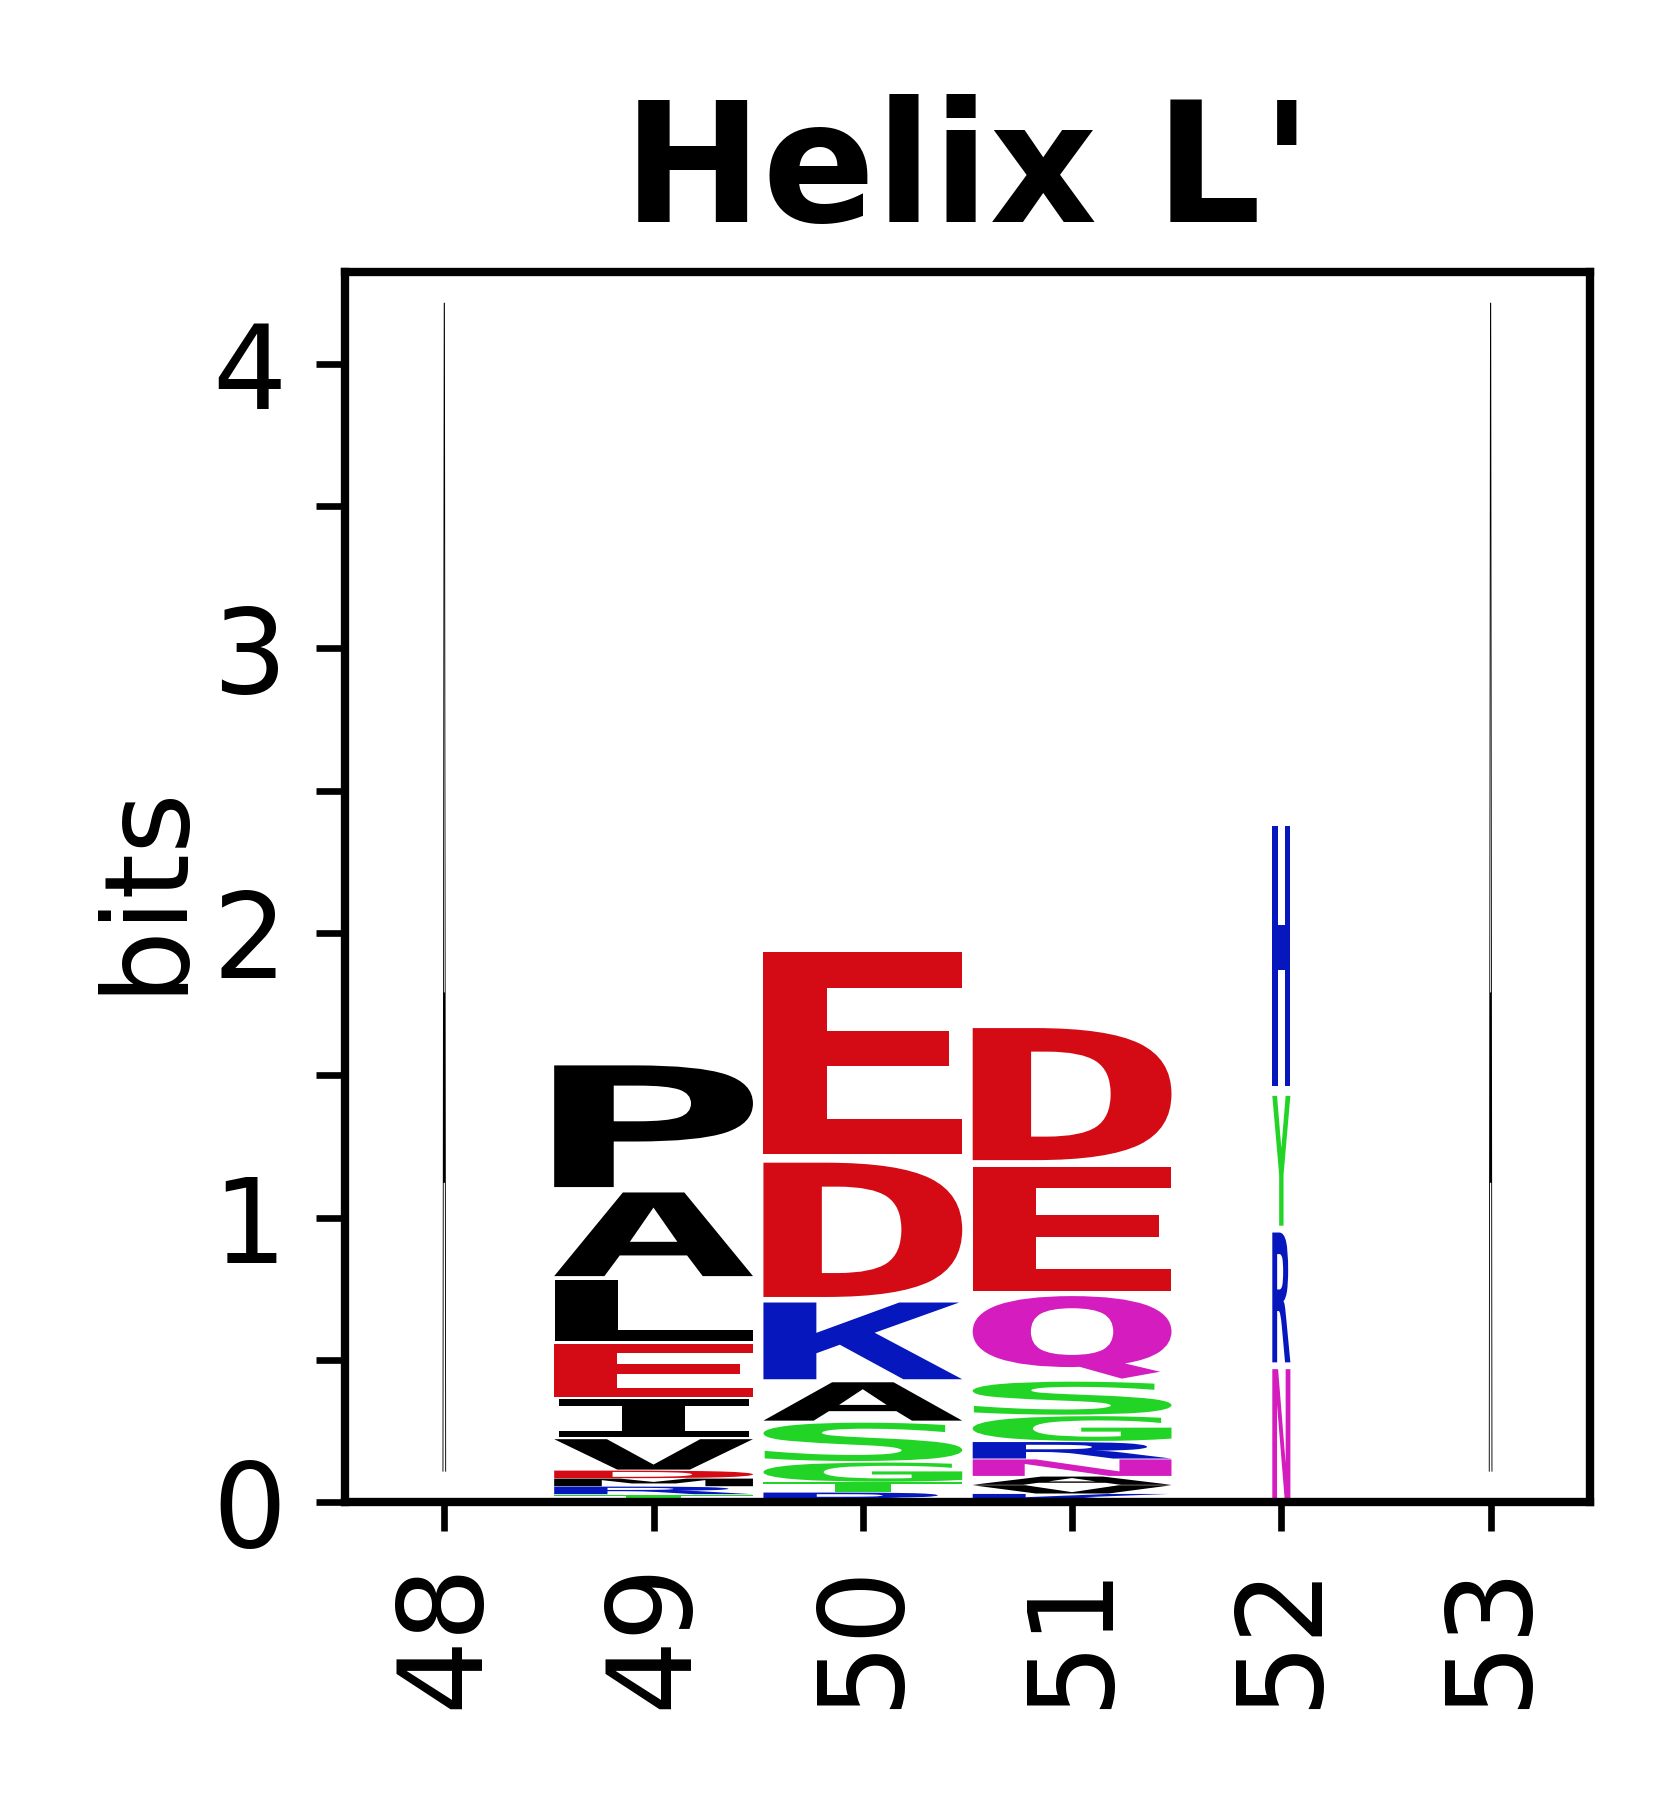
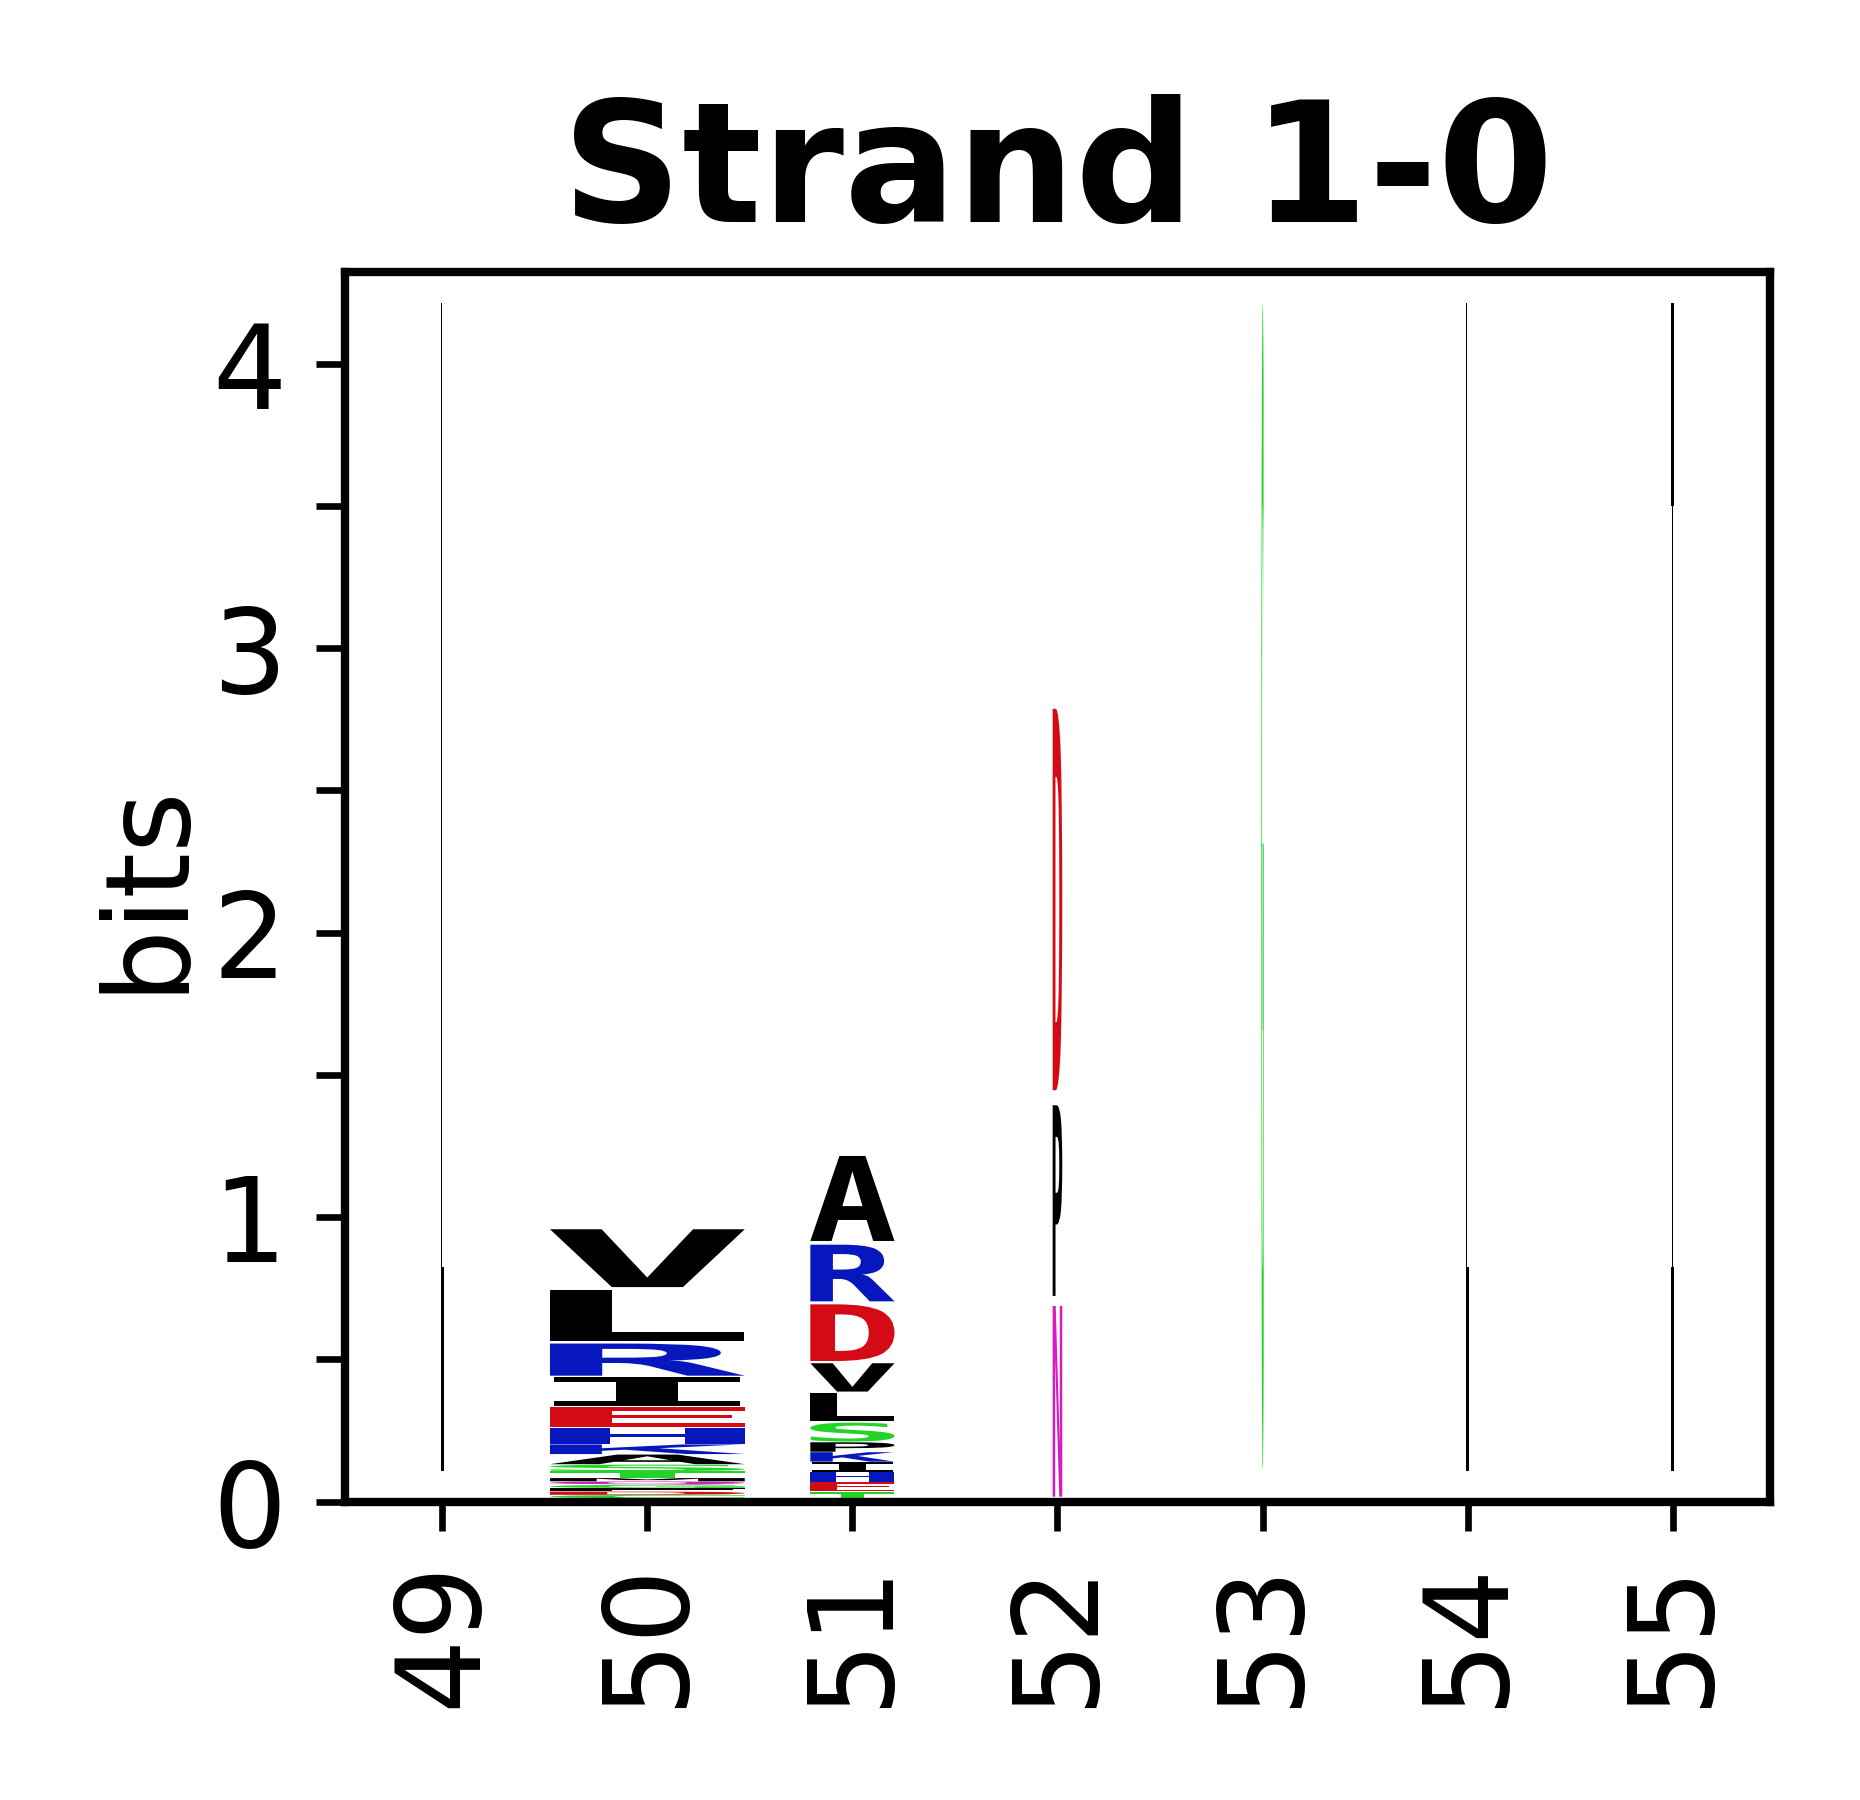
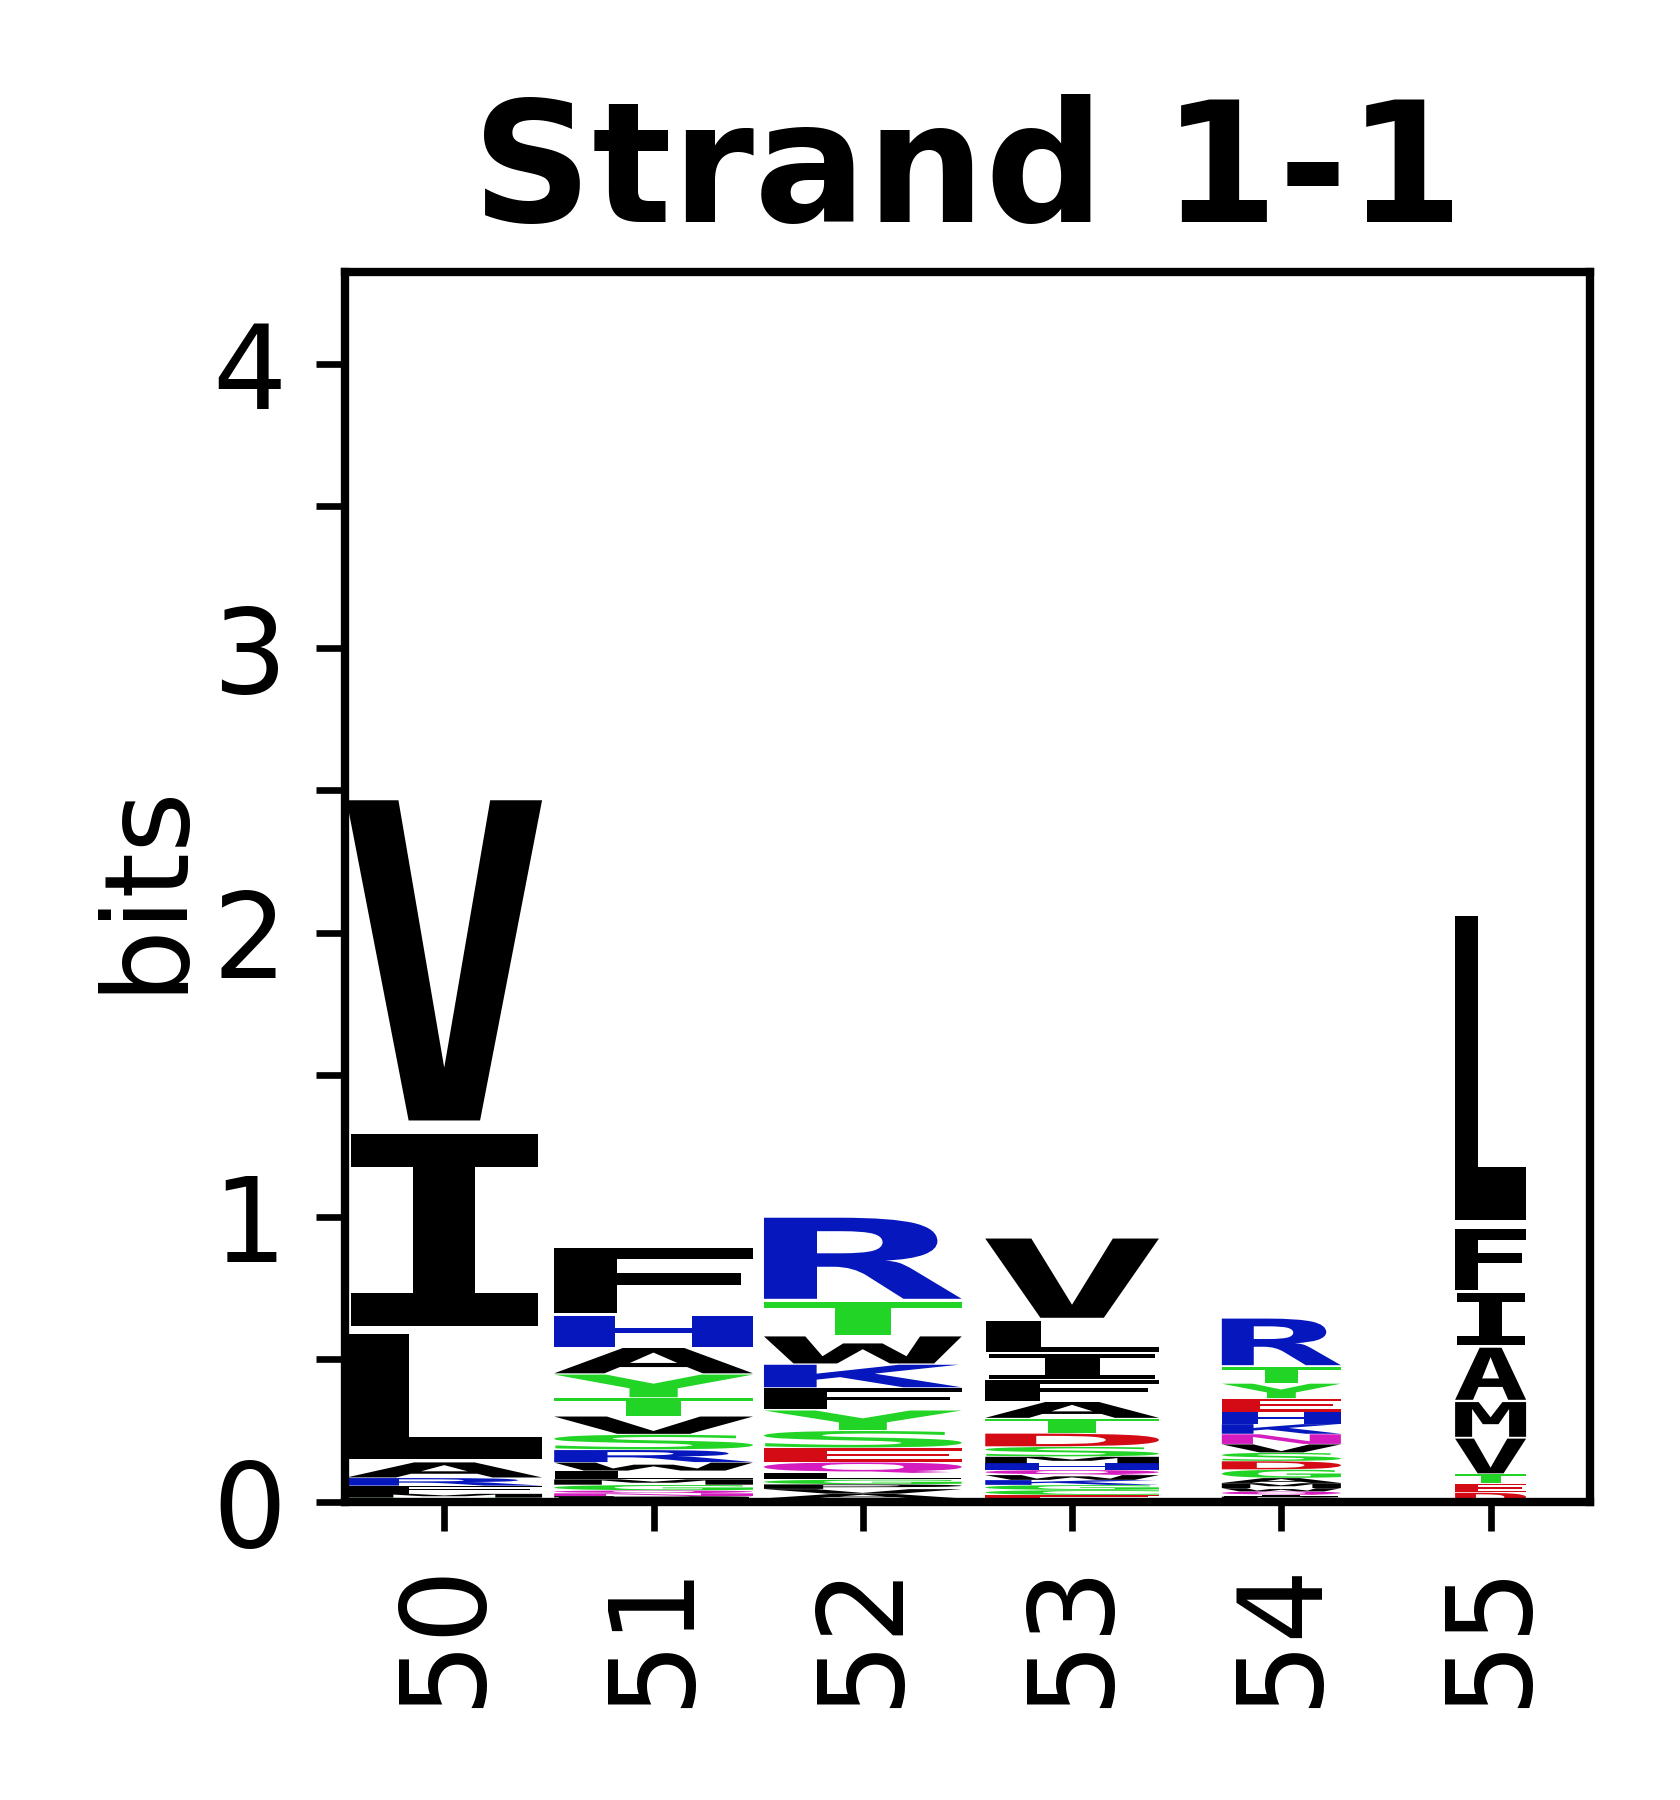
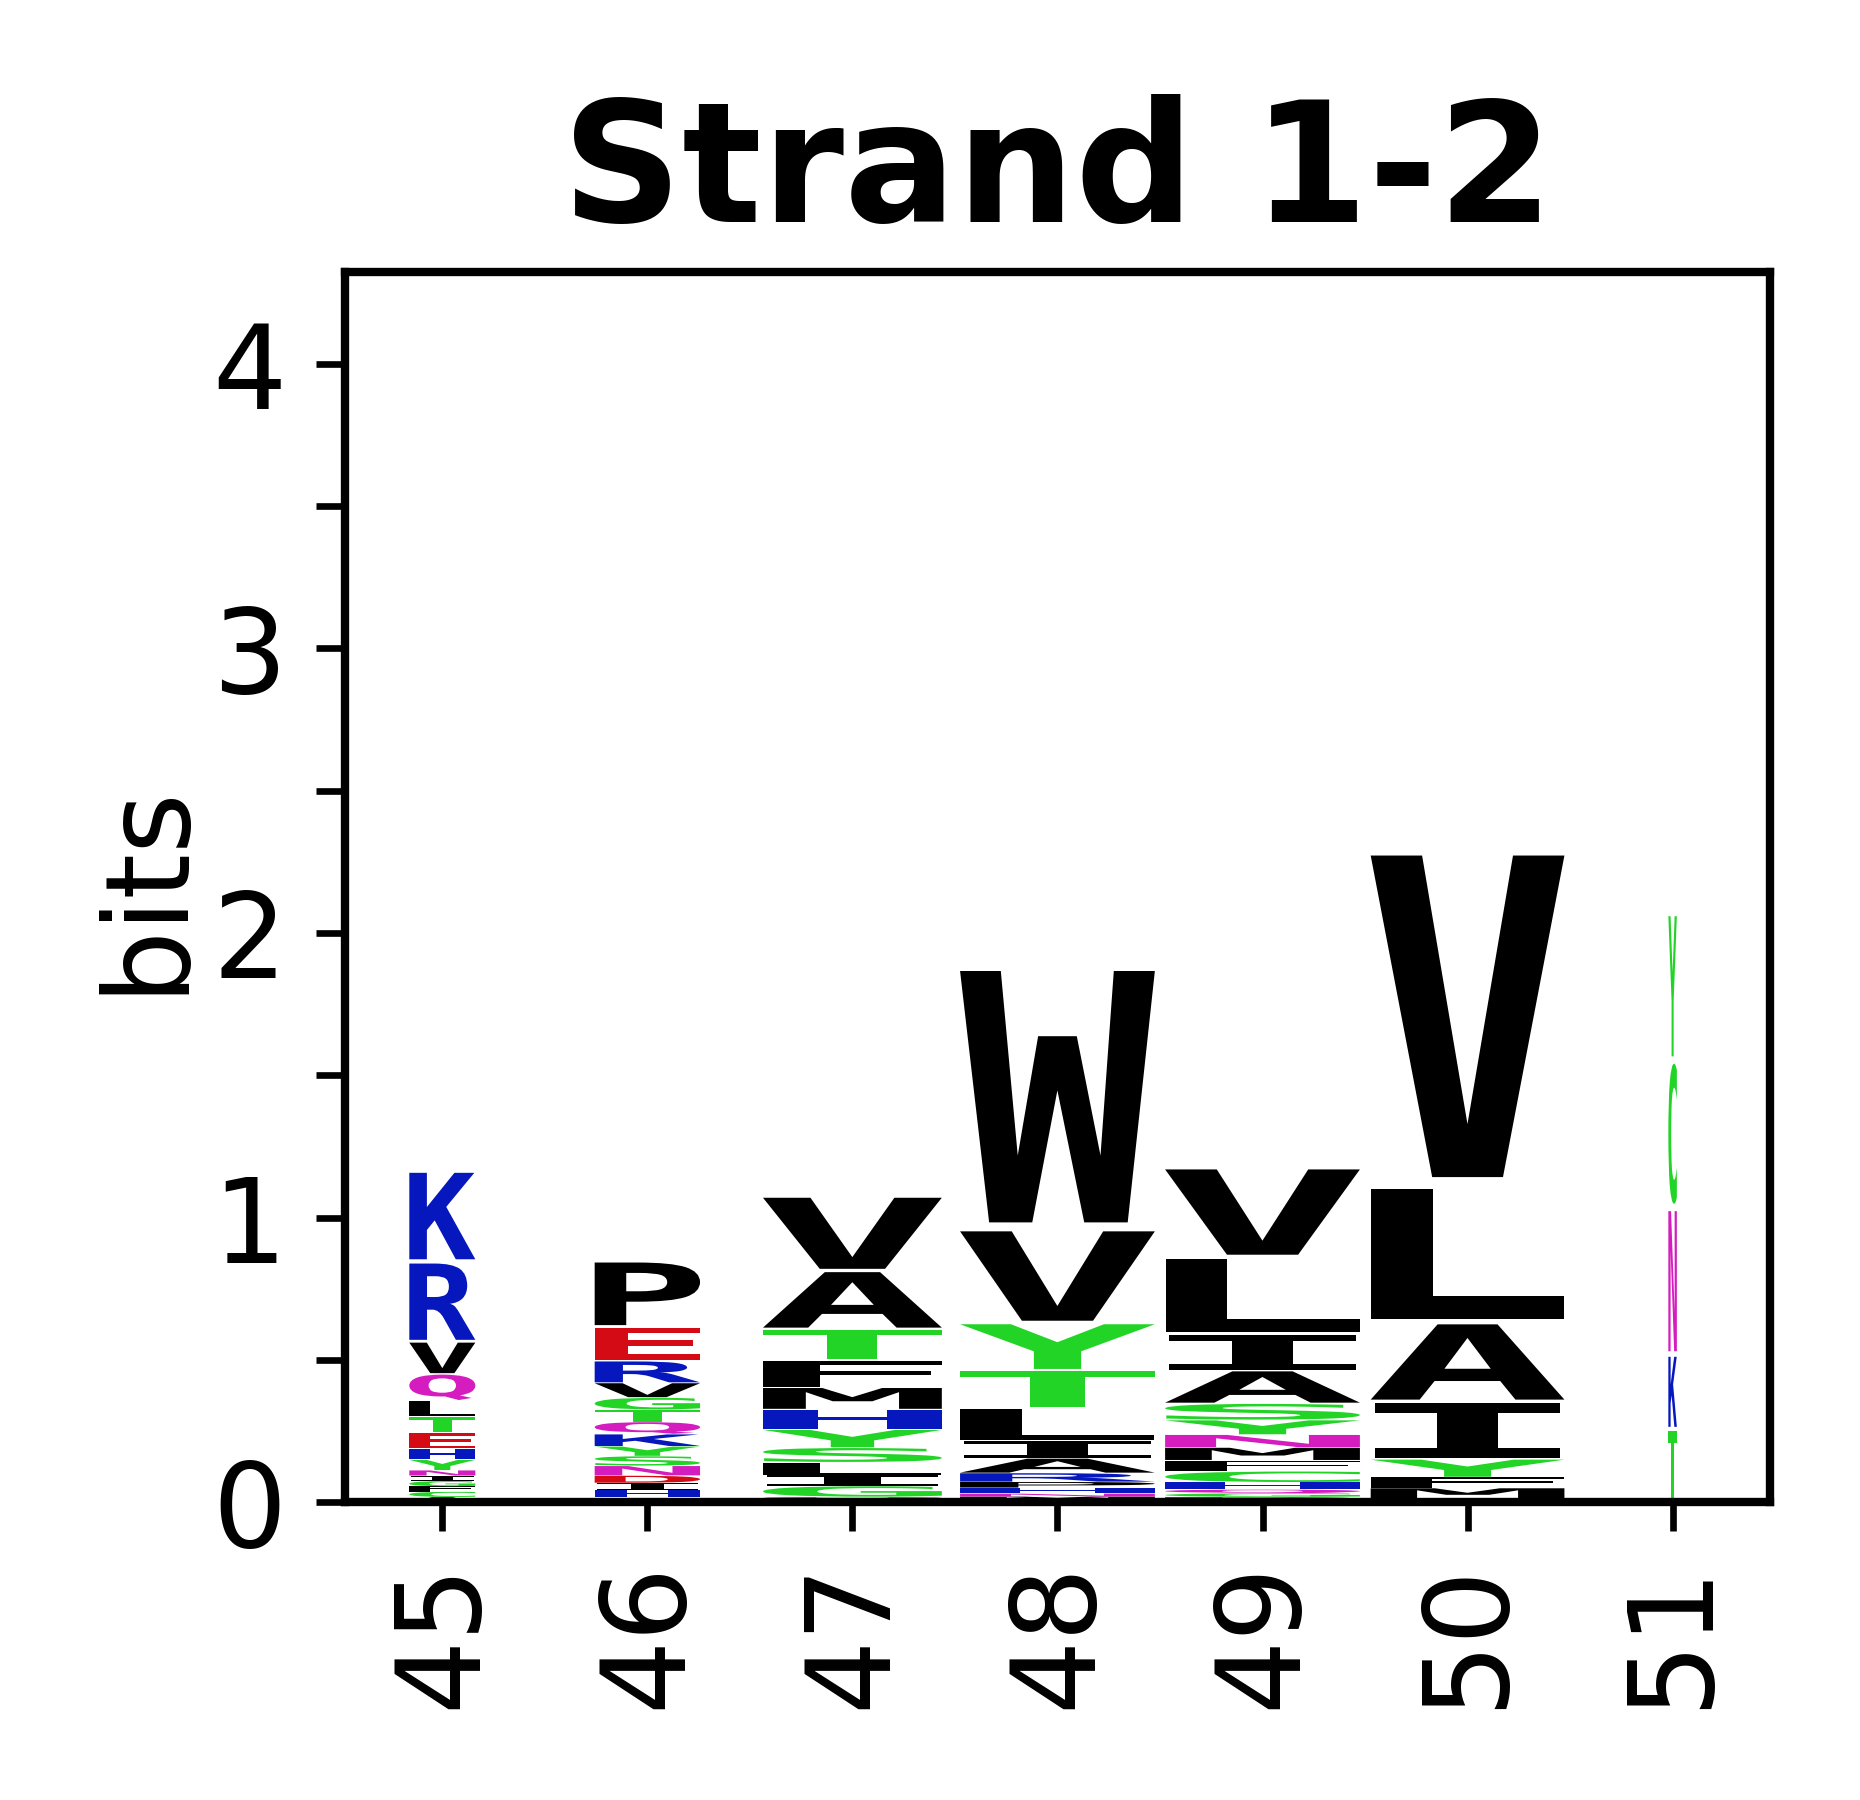
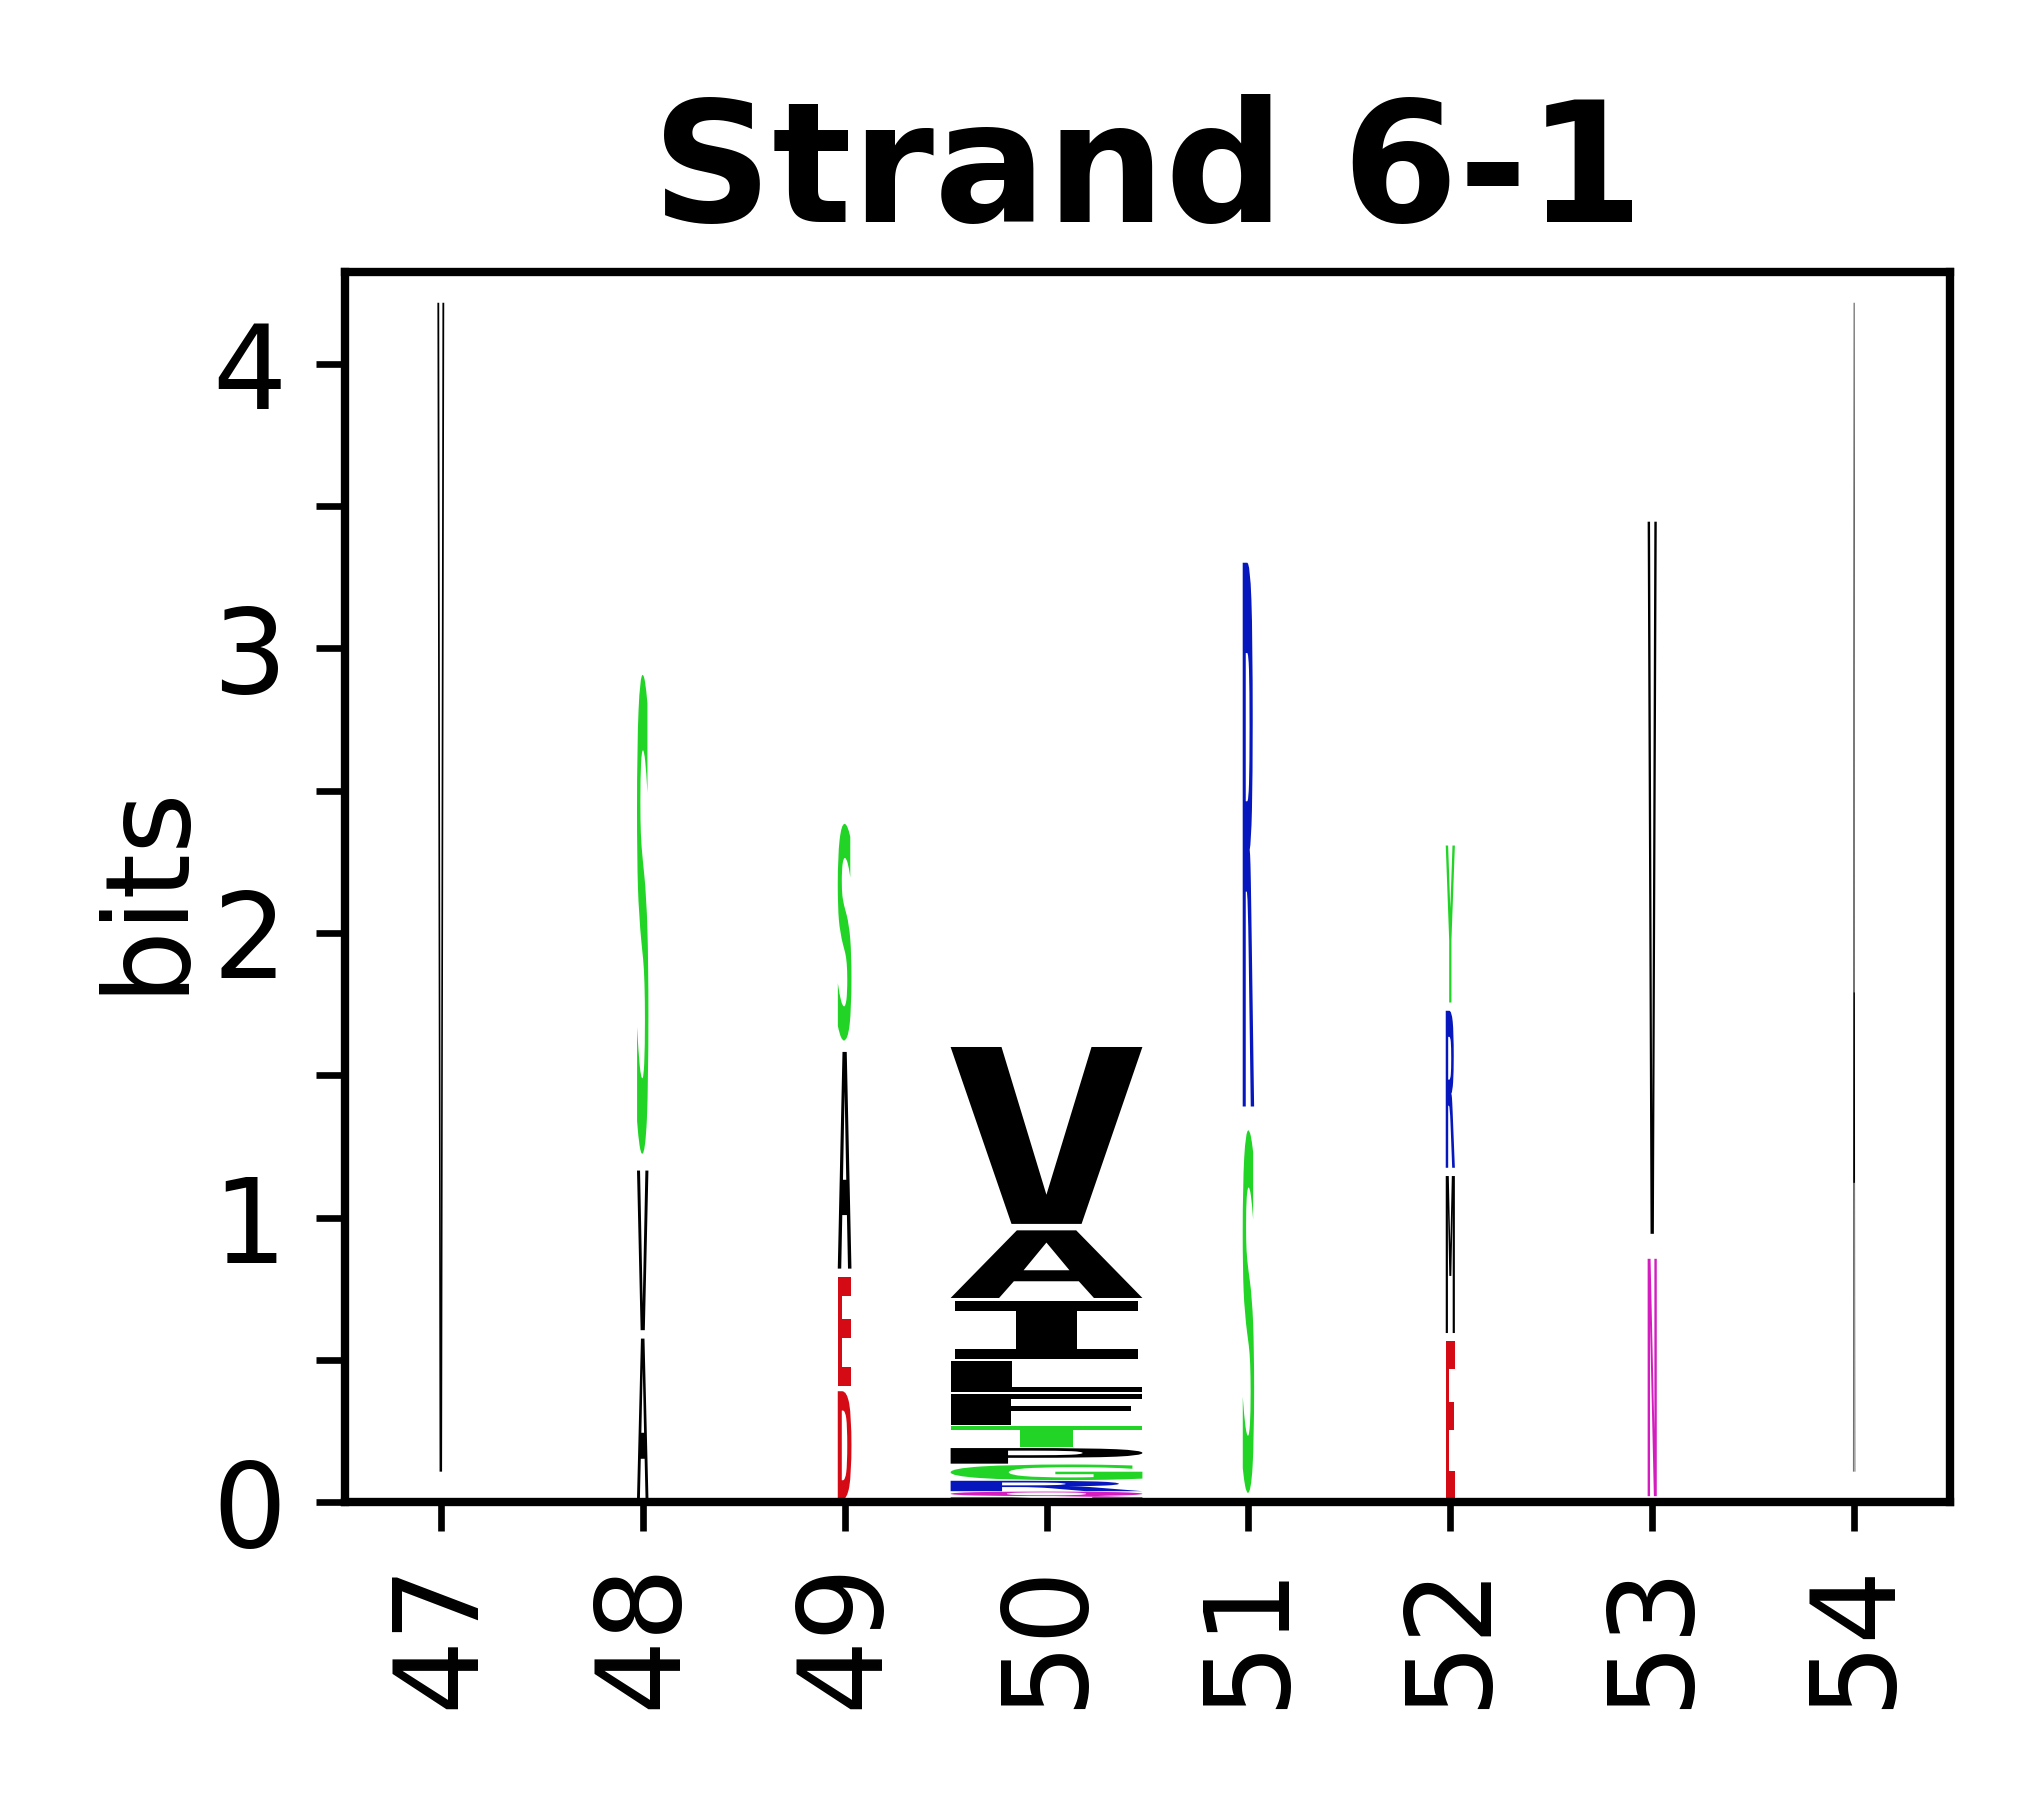
The amino acid sequences for each SSE can be aligned and used to produce a sequence logo. Where the sequence conservation is sufficient, we can establish a generic numbering scheme: the most conserved residue in helix X serves as its reference residue and is numbered as @X.50. The remaining residues in the helix are numbered accordingly. | The amino acid sequences for each SSE can be aligned and used to produce a sequence logo. Where the sequence conservation is sufficient, we can establish a generic numbering scheme: the most conserved residue in helix X serves as its reference residue and is numbered as @X.50. The remaining residues in the helix are numbered accordingly. | ||
<gallery mode="packed" heights=140px caption="Helices"> | |||
File:SecStrAnnotator-cyp-sse-logo-A-.png | |||
File:SecStrAnnotator-cyp-sse-logo-A.png | |||
File:SecStrAnnotator-cyp-sse-logo-B.png | |||
File:SecStrAnnotator-cyp-sse-logo-B-.png | |||
File:SecStrAnnotator-cyp-sse-logo-B--.png | |||
File:SecStrAnnotator-cyp-sse-logo-C.png | |||
File:SecStrAnnotator-cyp-sse-logo-D.png | |||
File:SecStrAnnotator-cyp-sse-logo-E.png | |||
File:SecStrAnnotator-cyp-sse-logo-F.png | |||
File:SecStrAnnotator-cyp-sse-logo-F-.png | |||
File:SecStrAnnotator-cyp-sse-logo-G-.png | |||
File:SecStrAnnotator-cyp-sse-logo-G.png | |||
File:SecStrAnnotator-cyp-sse-logo-H.png | |||
File:SecStrAnnotator-cyp-sse-logo-I.png | |||
File:SecStrAnnotator-cyp-sse-logo-J.png | |||
File:SecStrAnnotator-cyp-sse-logo-J-.png | |||
File:SecStrAnnotator-cyp-sse-logo-K.png | |||
File:SecStrAnnotator-cyp-sse-logo-K-.png | |||
File:SecStrAnnotator-cyp-sse-logo-K--.png | |||
File:SecStrAnnotator-cyp-sse-logo-L.png | |||
File:SecStrAnnotator-cyp-sse-logo-L-.png | |||
</gallery> | |||
<gallery mode="packed" heights=140px caption="Beta strands"> | |||
File:SecStrAnnotator-cyp-sse-logo-1-0.png | |||
File:SecStrAnnotator-cyp-sse-logo-1-1.png | |||
File:SecStrAnnotator-cyp-sse-logo-1-2.png | |||
File:SecStrAnnotator-cyp-sse-logo-1-3.png | |||
File:SecStrAnnotator-cyp-sse-logo-1-4.png | |||
File:SecStrAnnotator-cyp-sse-logo-1-5.png | |||
File:SecStrAnnotator-cyp-sse-logo-2-1.png | |||
File:SecStrAnnotator-cyp-sse-logo-2-2.png | |||
File:SecStrAnnotator-cyp-sse-logo-3-1.png | |||
File:SecStrAnnotator-cyp-sse-logo-3-2.png | |||
File:SecStrAnnotator-cyp-sse-logo-3-3.png | |||
File:SecStrAnnotator-cyp-sse-logo-4-1.png | |||
File:SecStrAnnotator-cyp-sse-logo-4-2.png | |||
File:SecStrAnnotator-cyp-sse-logo-5-1.png | |||
File:SecStrAnnotator-cyp-sse-logo-5-2.png | |||
File:SecStrAnnotator-cyp-sse-logo-6-1.png | |||
File:SecStrAnnotator-cyp-sse-logo-6-2.png | |||
</gallery> | |||
<br style="clear:both" /> | <br style="clear:both" /> | ||
Latest revision as of 09:43, 16 July 2020
SecStrAnnotator Suite provides scripts (Python, R) for batch annotation of the whole family and analysis of the annotation results.
Procedure
Data preparation
The directory scripts/secstrapi_data_preparation/ contains a pipeline for annotating the whole protein family, including:
- downloading the list of family members defined by CATH and Pfam,
- downloading their structures,
- selecting a non-redundant set,
- annotation,
- multiple sequence alignment for individual SSEs,
- formatting into SecStrAPI format,
- formatting into TSV format for further analyses.
The whole pipeline can be executed by scripts/SecStrAPI_pipeline.py
Example usage:
python3 scripts/SecStrAPI_pipeline.py scripts/SecStrAPI_pipeline_settings.json --resume
Before running, modify the settings in SecStrAPI_pipeline_settings.json to set your family of interest, annotation template, data directory etc (see README.txt for more details).
Data analysis
The directory scripts/R_sec_str_anatomy_analysis/ contains a pipeline for statistical analysis of the annotation results on the whole protein family, including:
- reading the annotation results from TSV,
- generating plots,
- performing statistical test to compare eukaryotic and bacterial structures (or any two sets of structures).
Example usage:
- Launch
rstudiofrom the said directory - In
sec_str_anatomy.R, set DATADIR to the path to your annotation data created in #Data preparation - In
sec_str_anatomy_settings.R, modify the family-specific settings (list of helices and strands) - Run
sec_str_anatomy.Rline by line
Example case study: Cytochromes P450
Data
For the Cytochrome P450 family, structures of 1855 protein domains are available, located in 1012 PDB entries (updated on 7 July 2020). The analysis was performed on a non-redundant subset containing 183 protein domains.
The data are available here (structural files not included because of their size).
Occurrence of SSEs
The occurrence describes in what percentage of the structures a particular SSE is present.
-
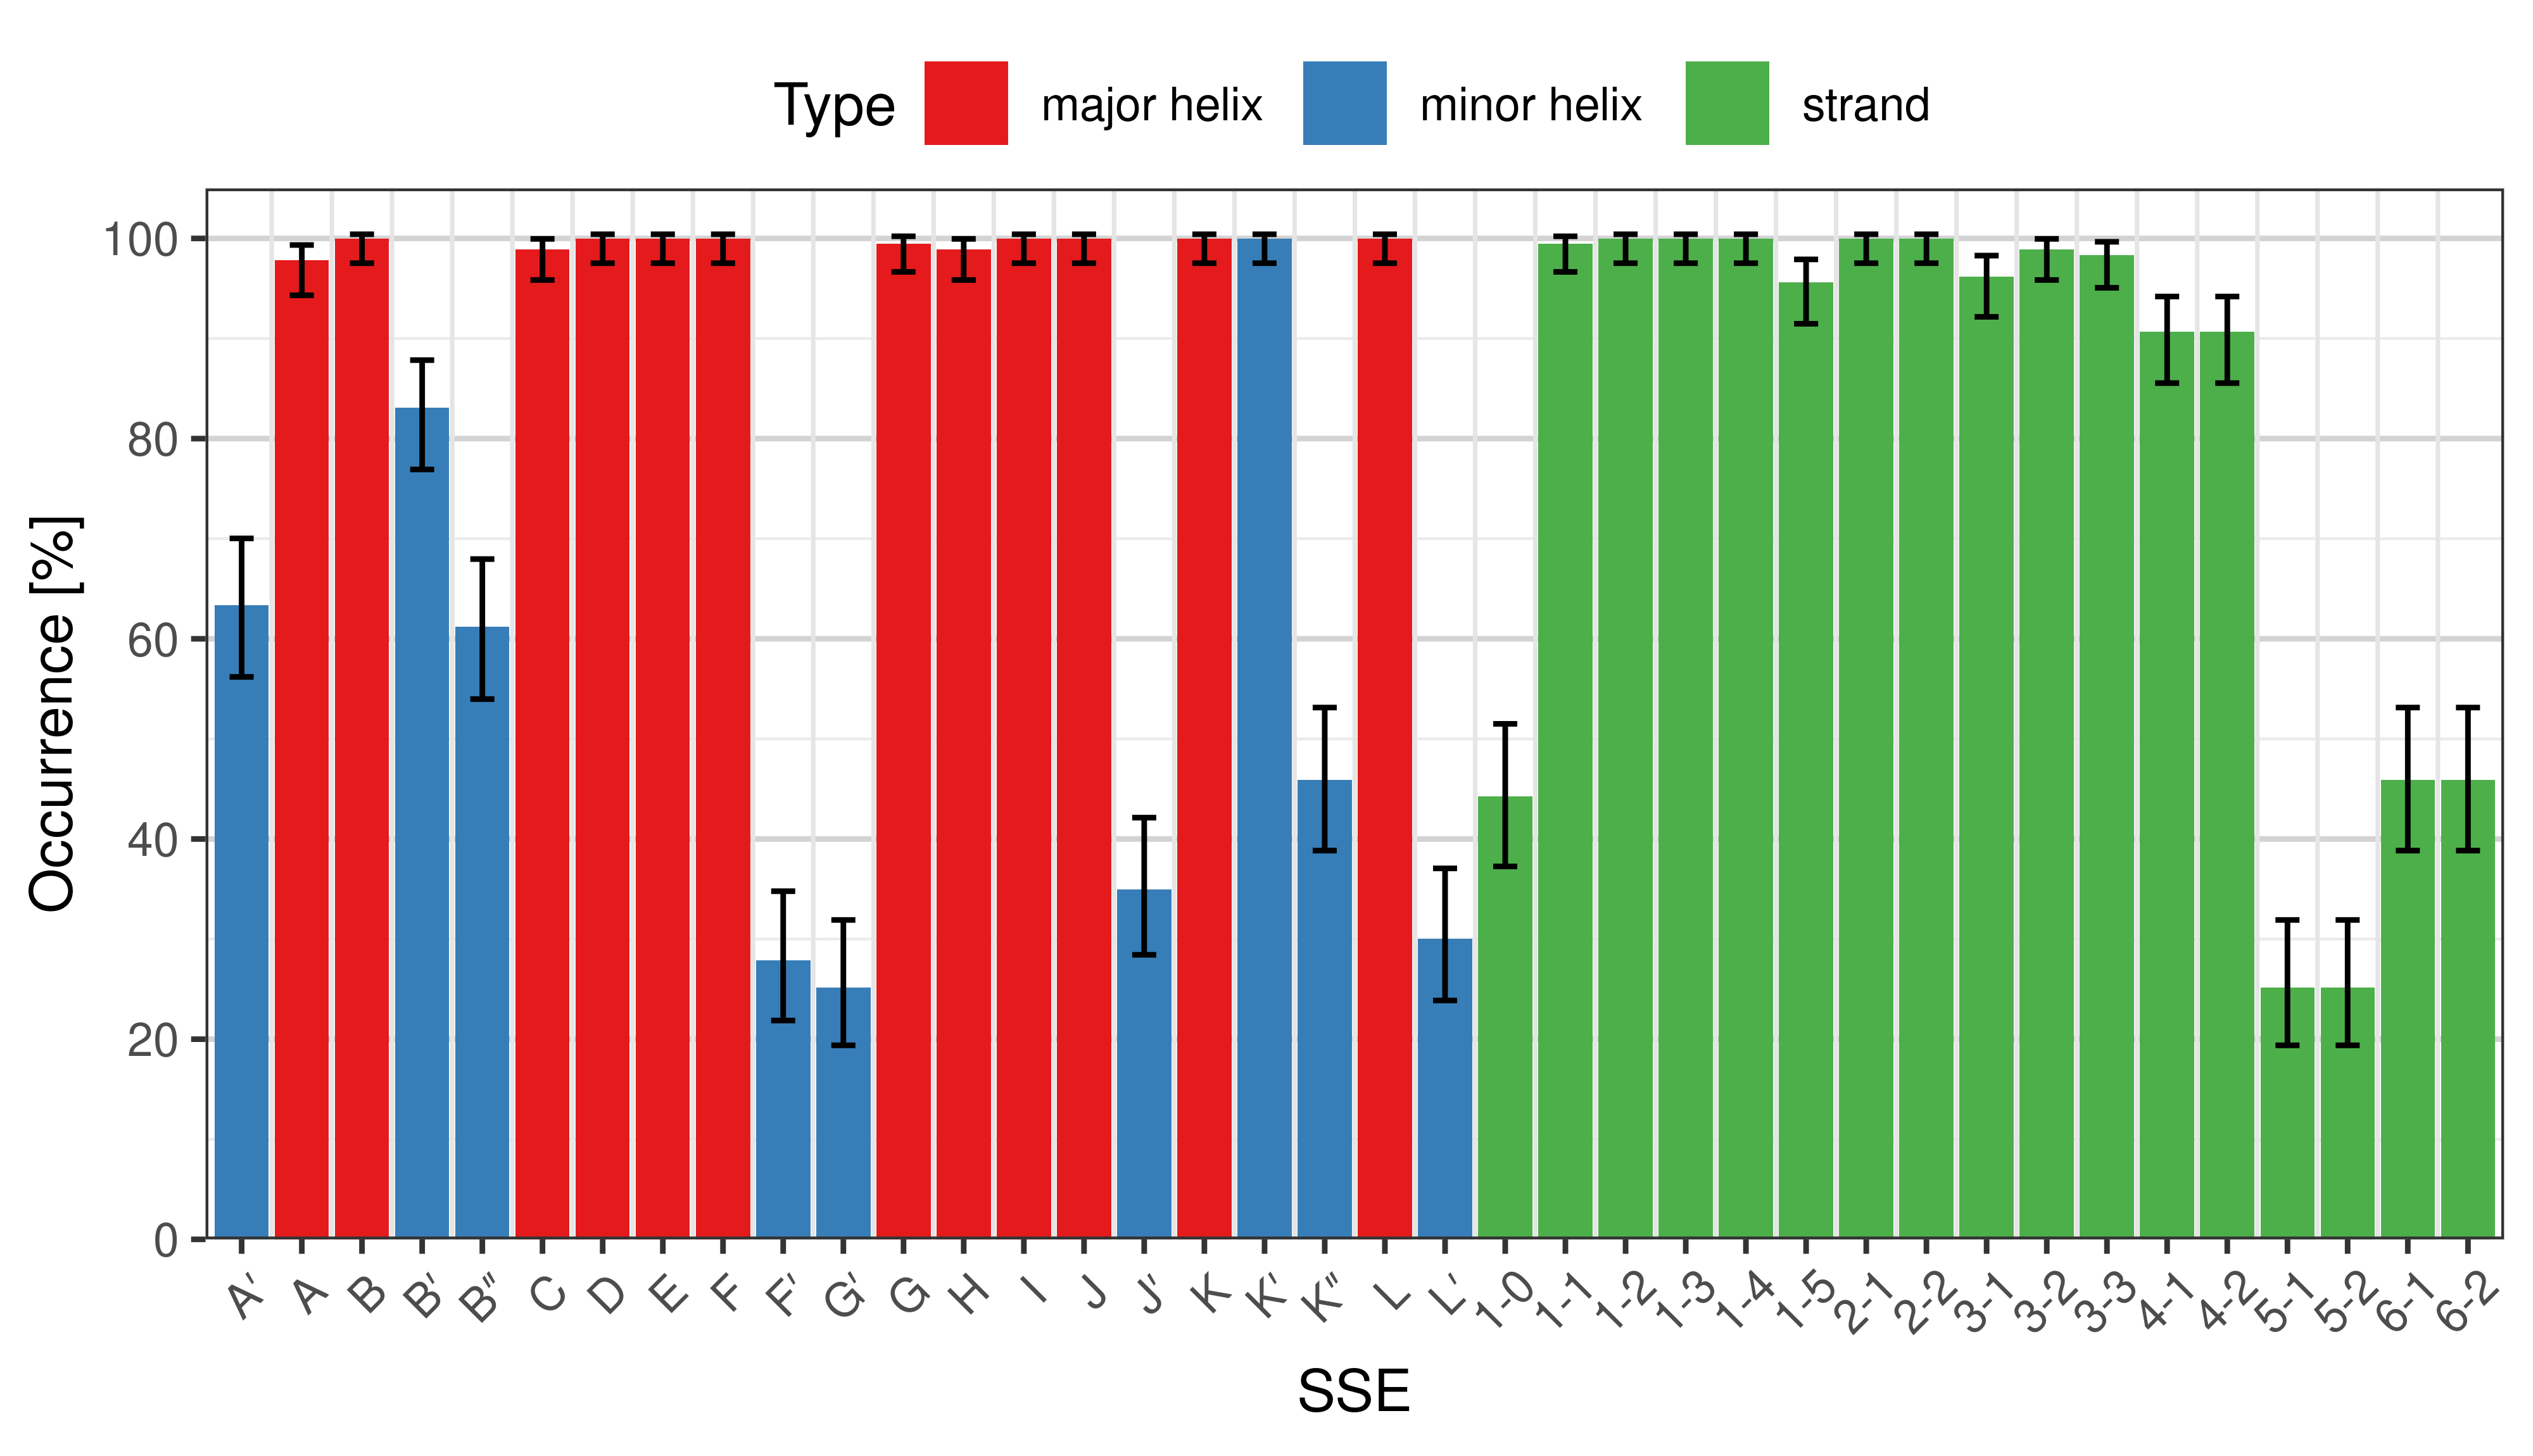
Occurrence of particular SSEs in the whole set. -
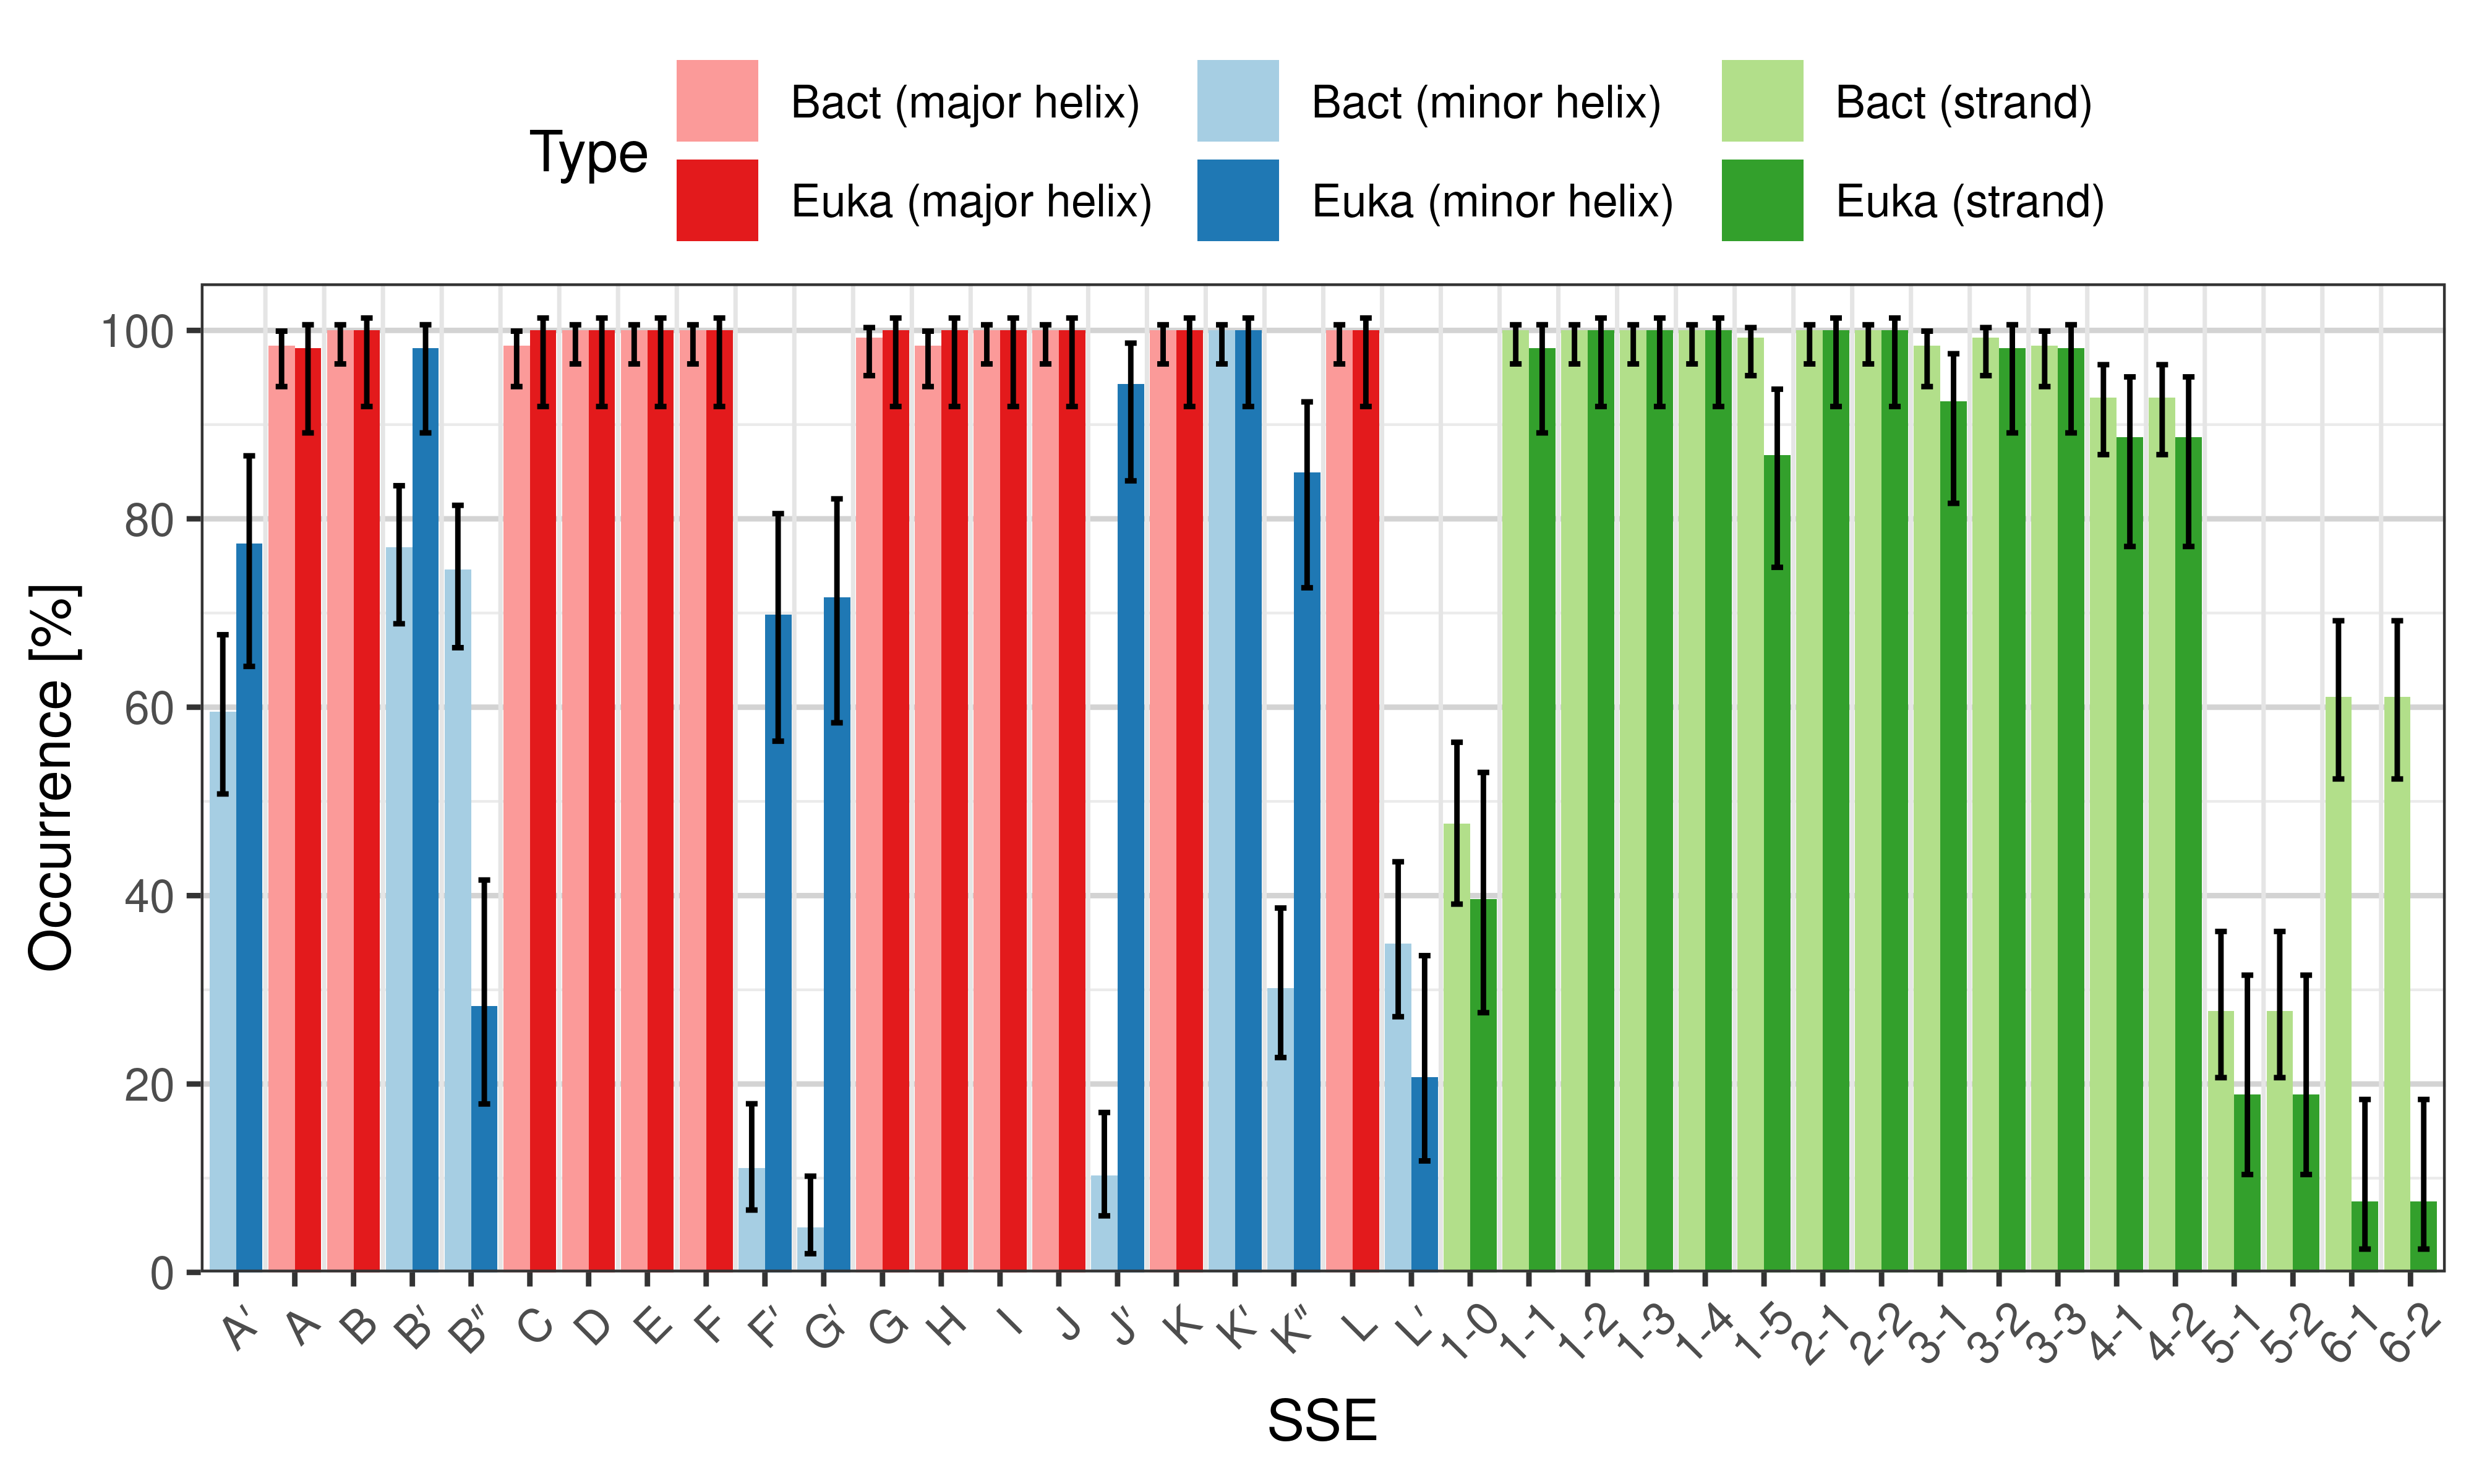
Occurrence of particular SSEs – comparison of bacterial and eukaryotic structures.


Length of SSEs
The length of an SSE is measured as the number of residues. The following violin plots show the distribution of length for each SSE.
-
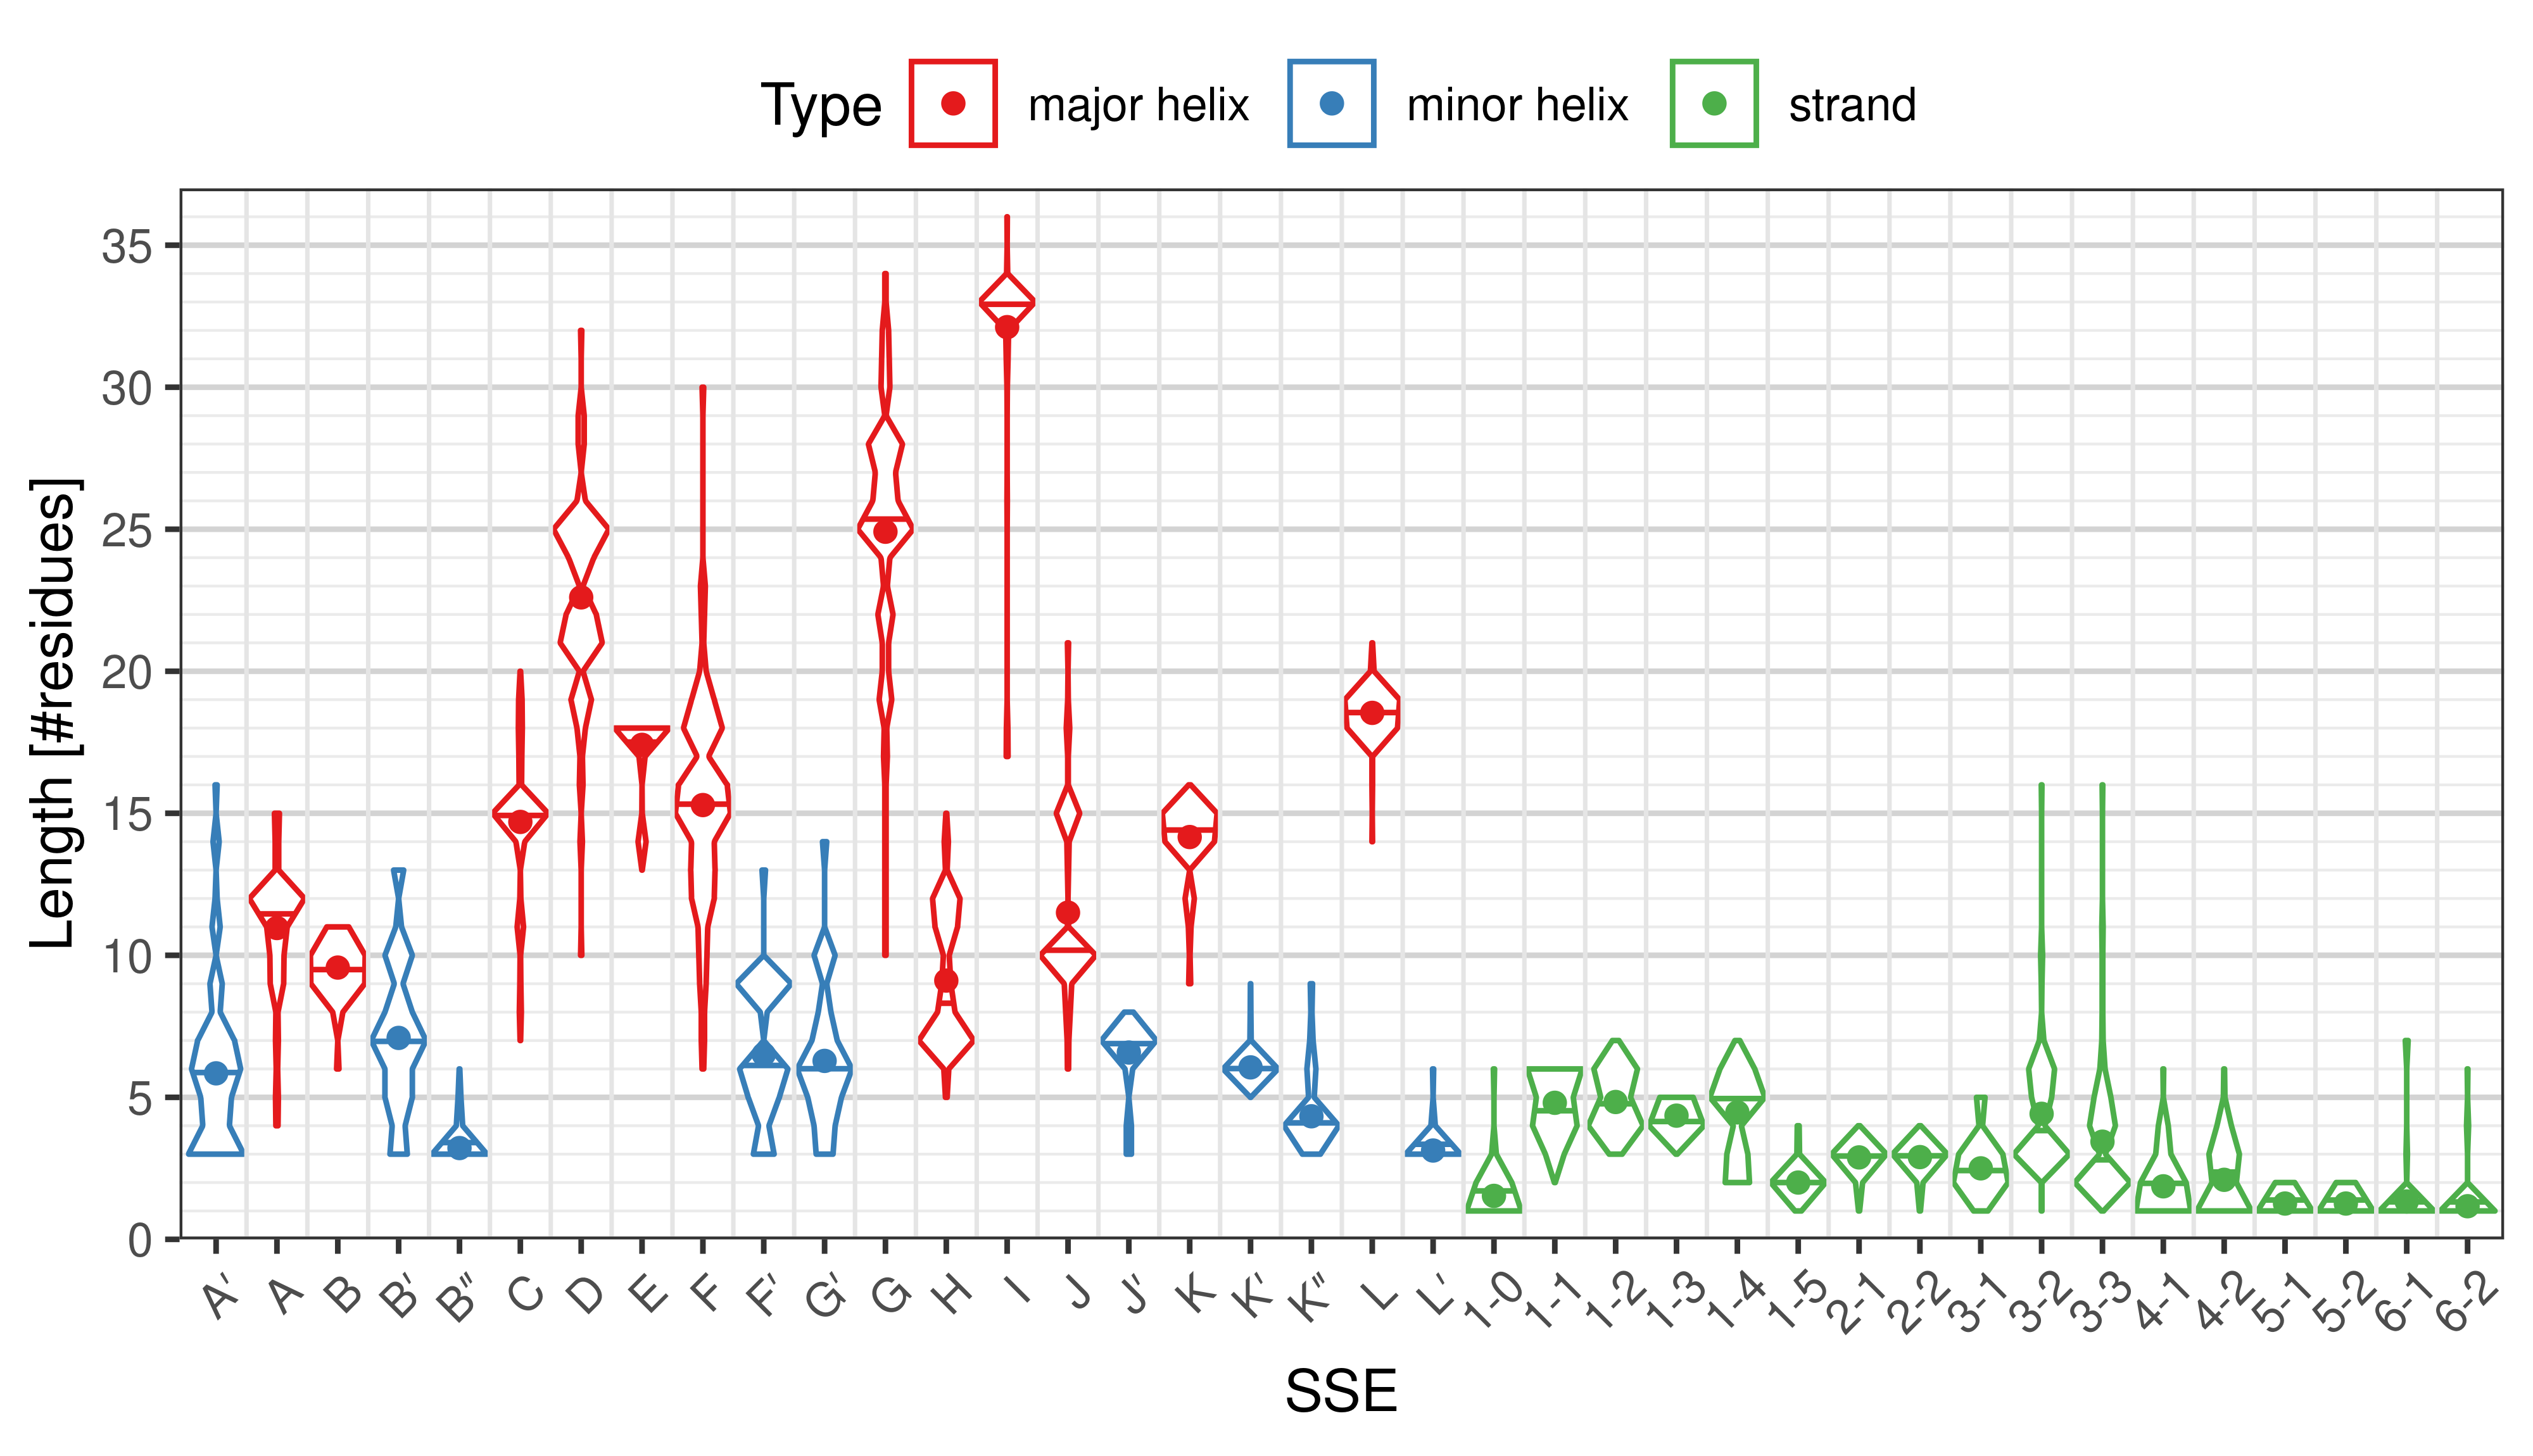
Length distribution of particular SSEs in the whole set. -
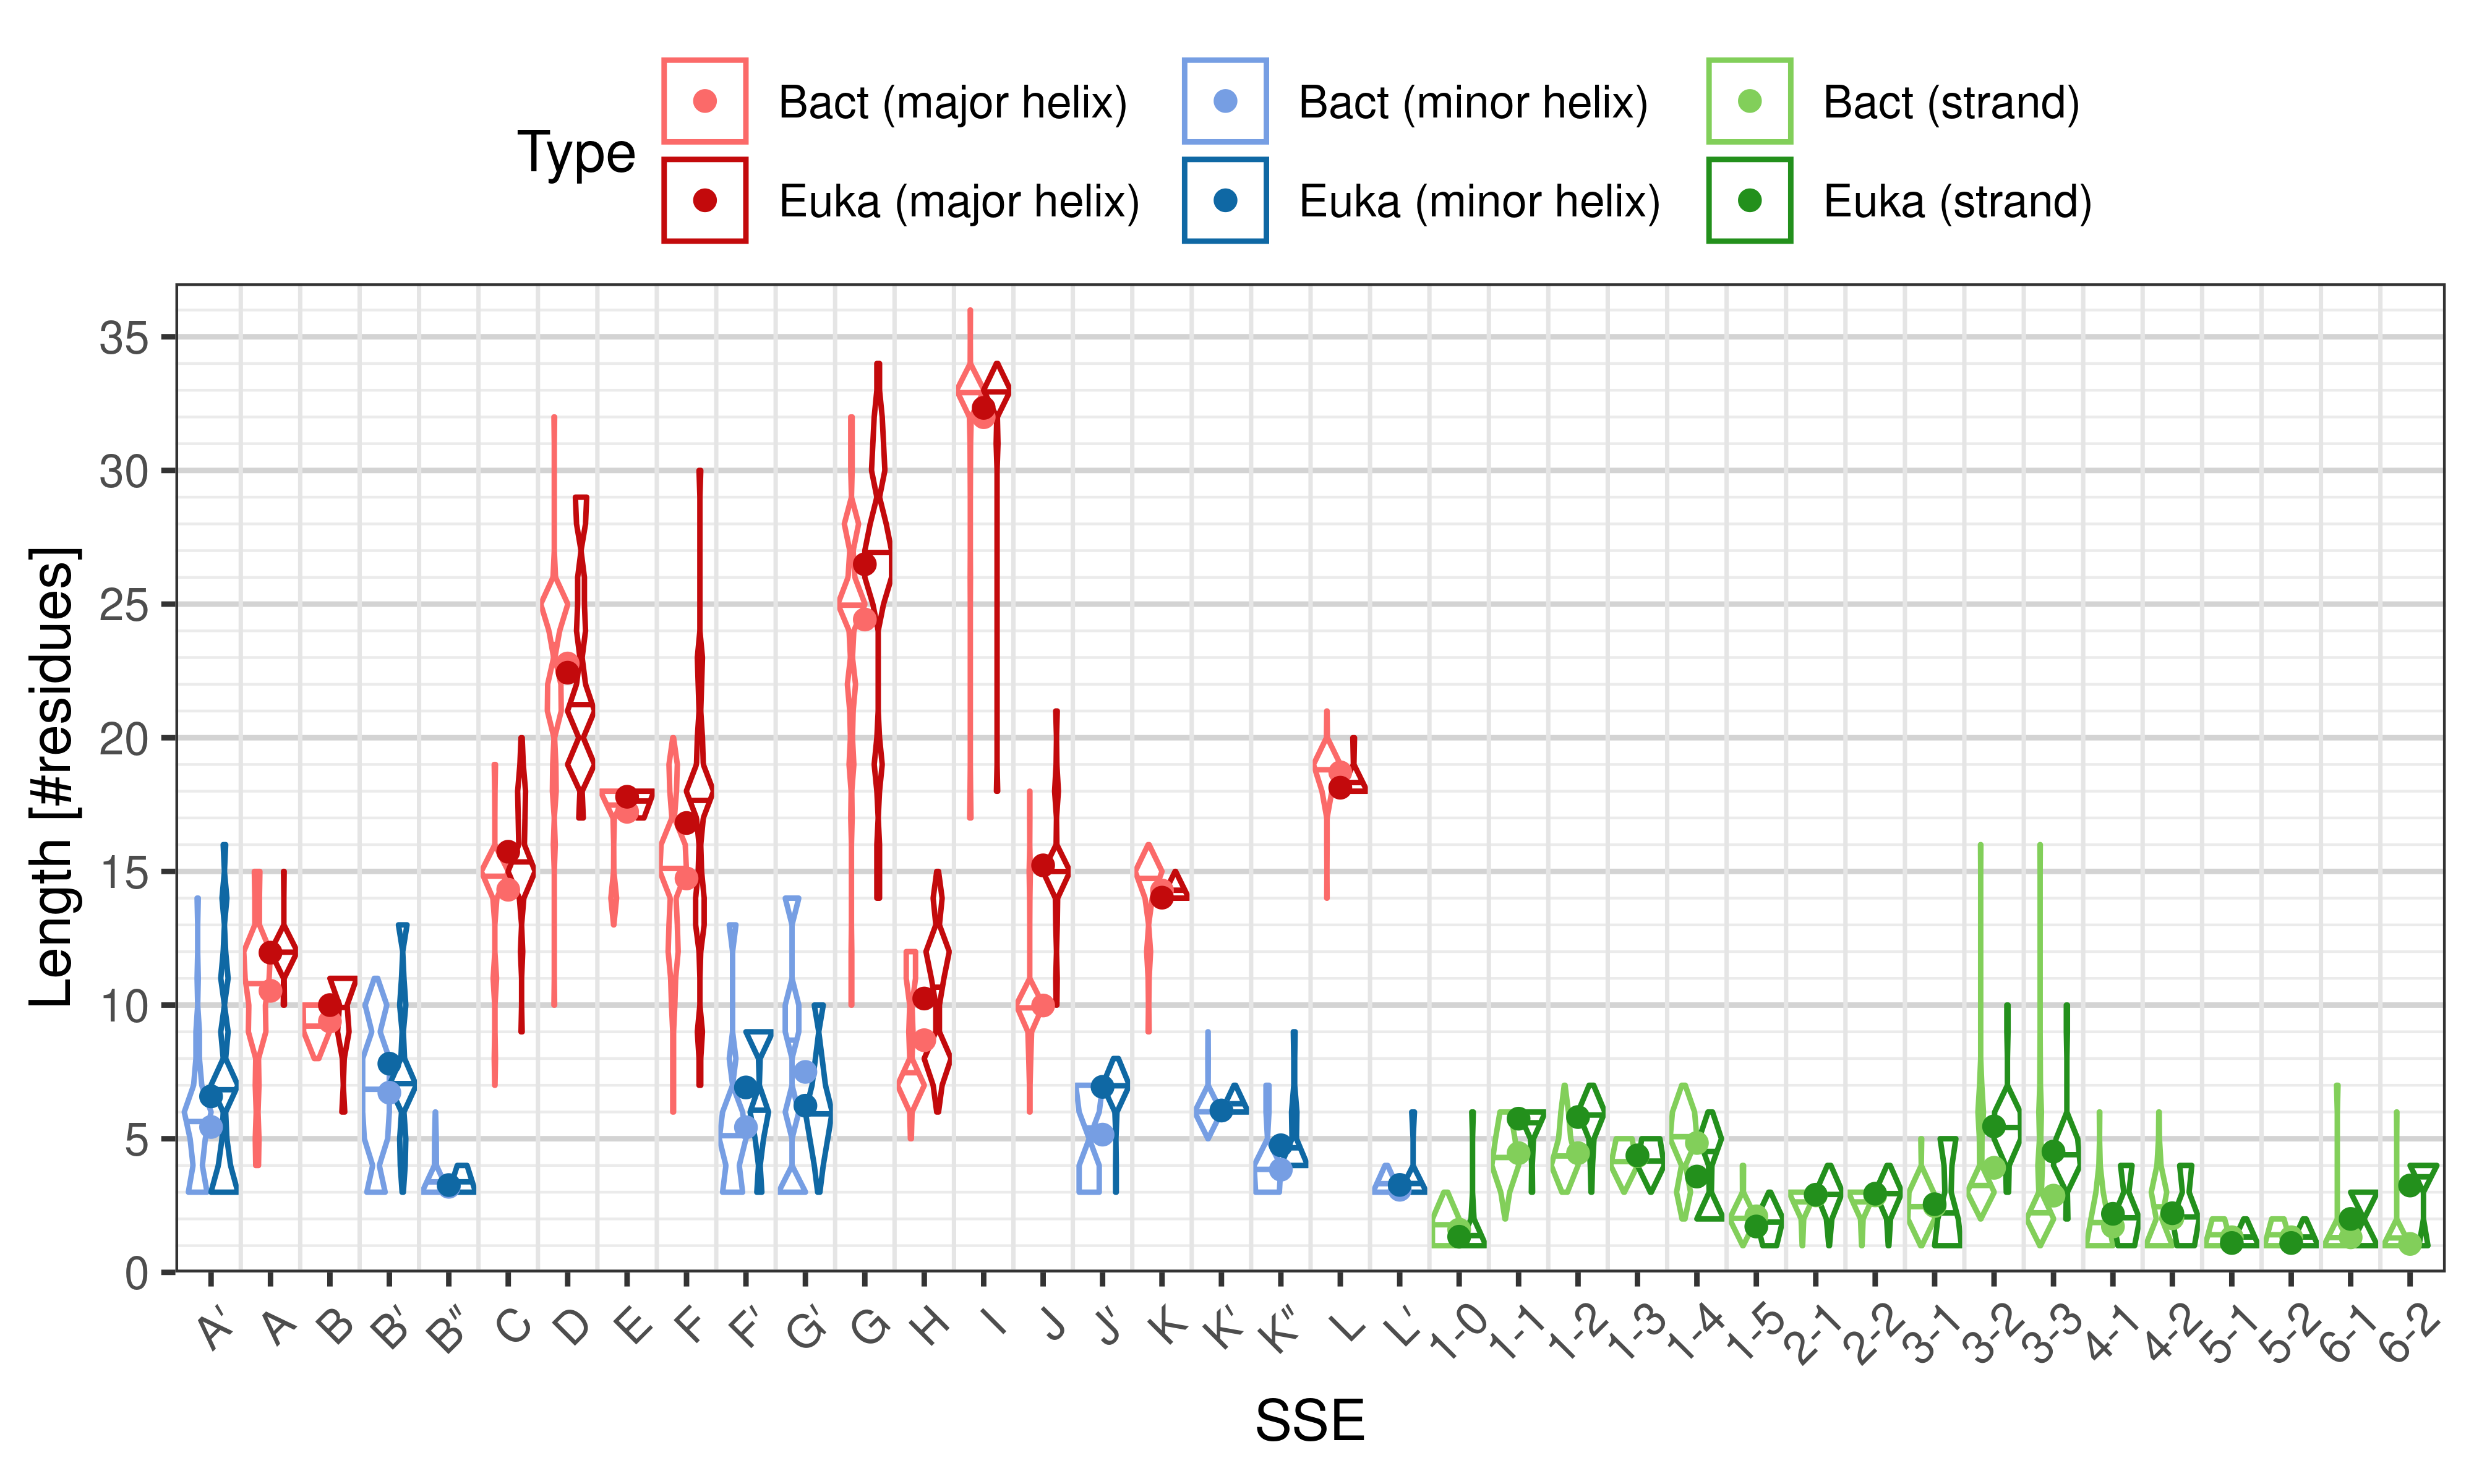
Length distribution of particular SSEs – comparison of bacterial and eukaryotic structures.


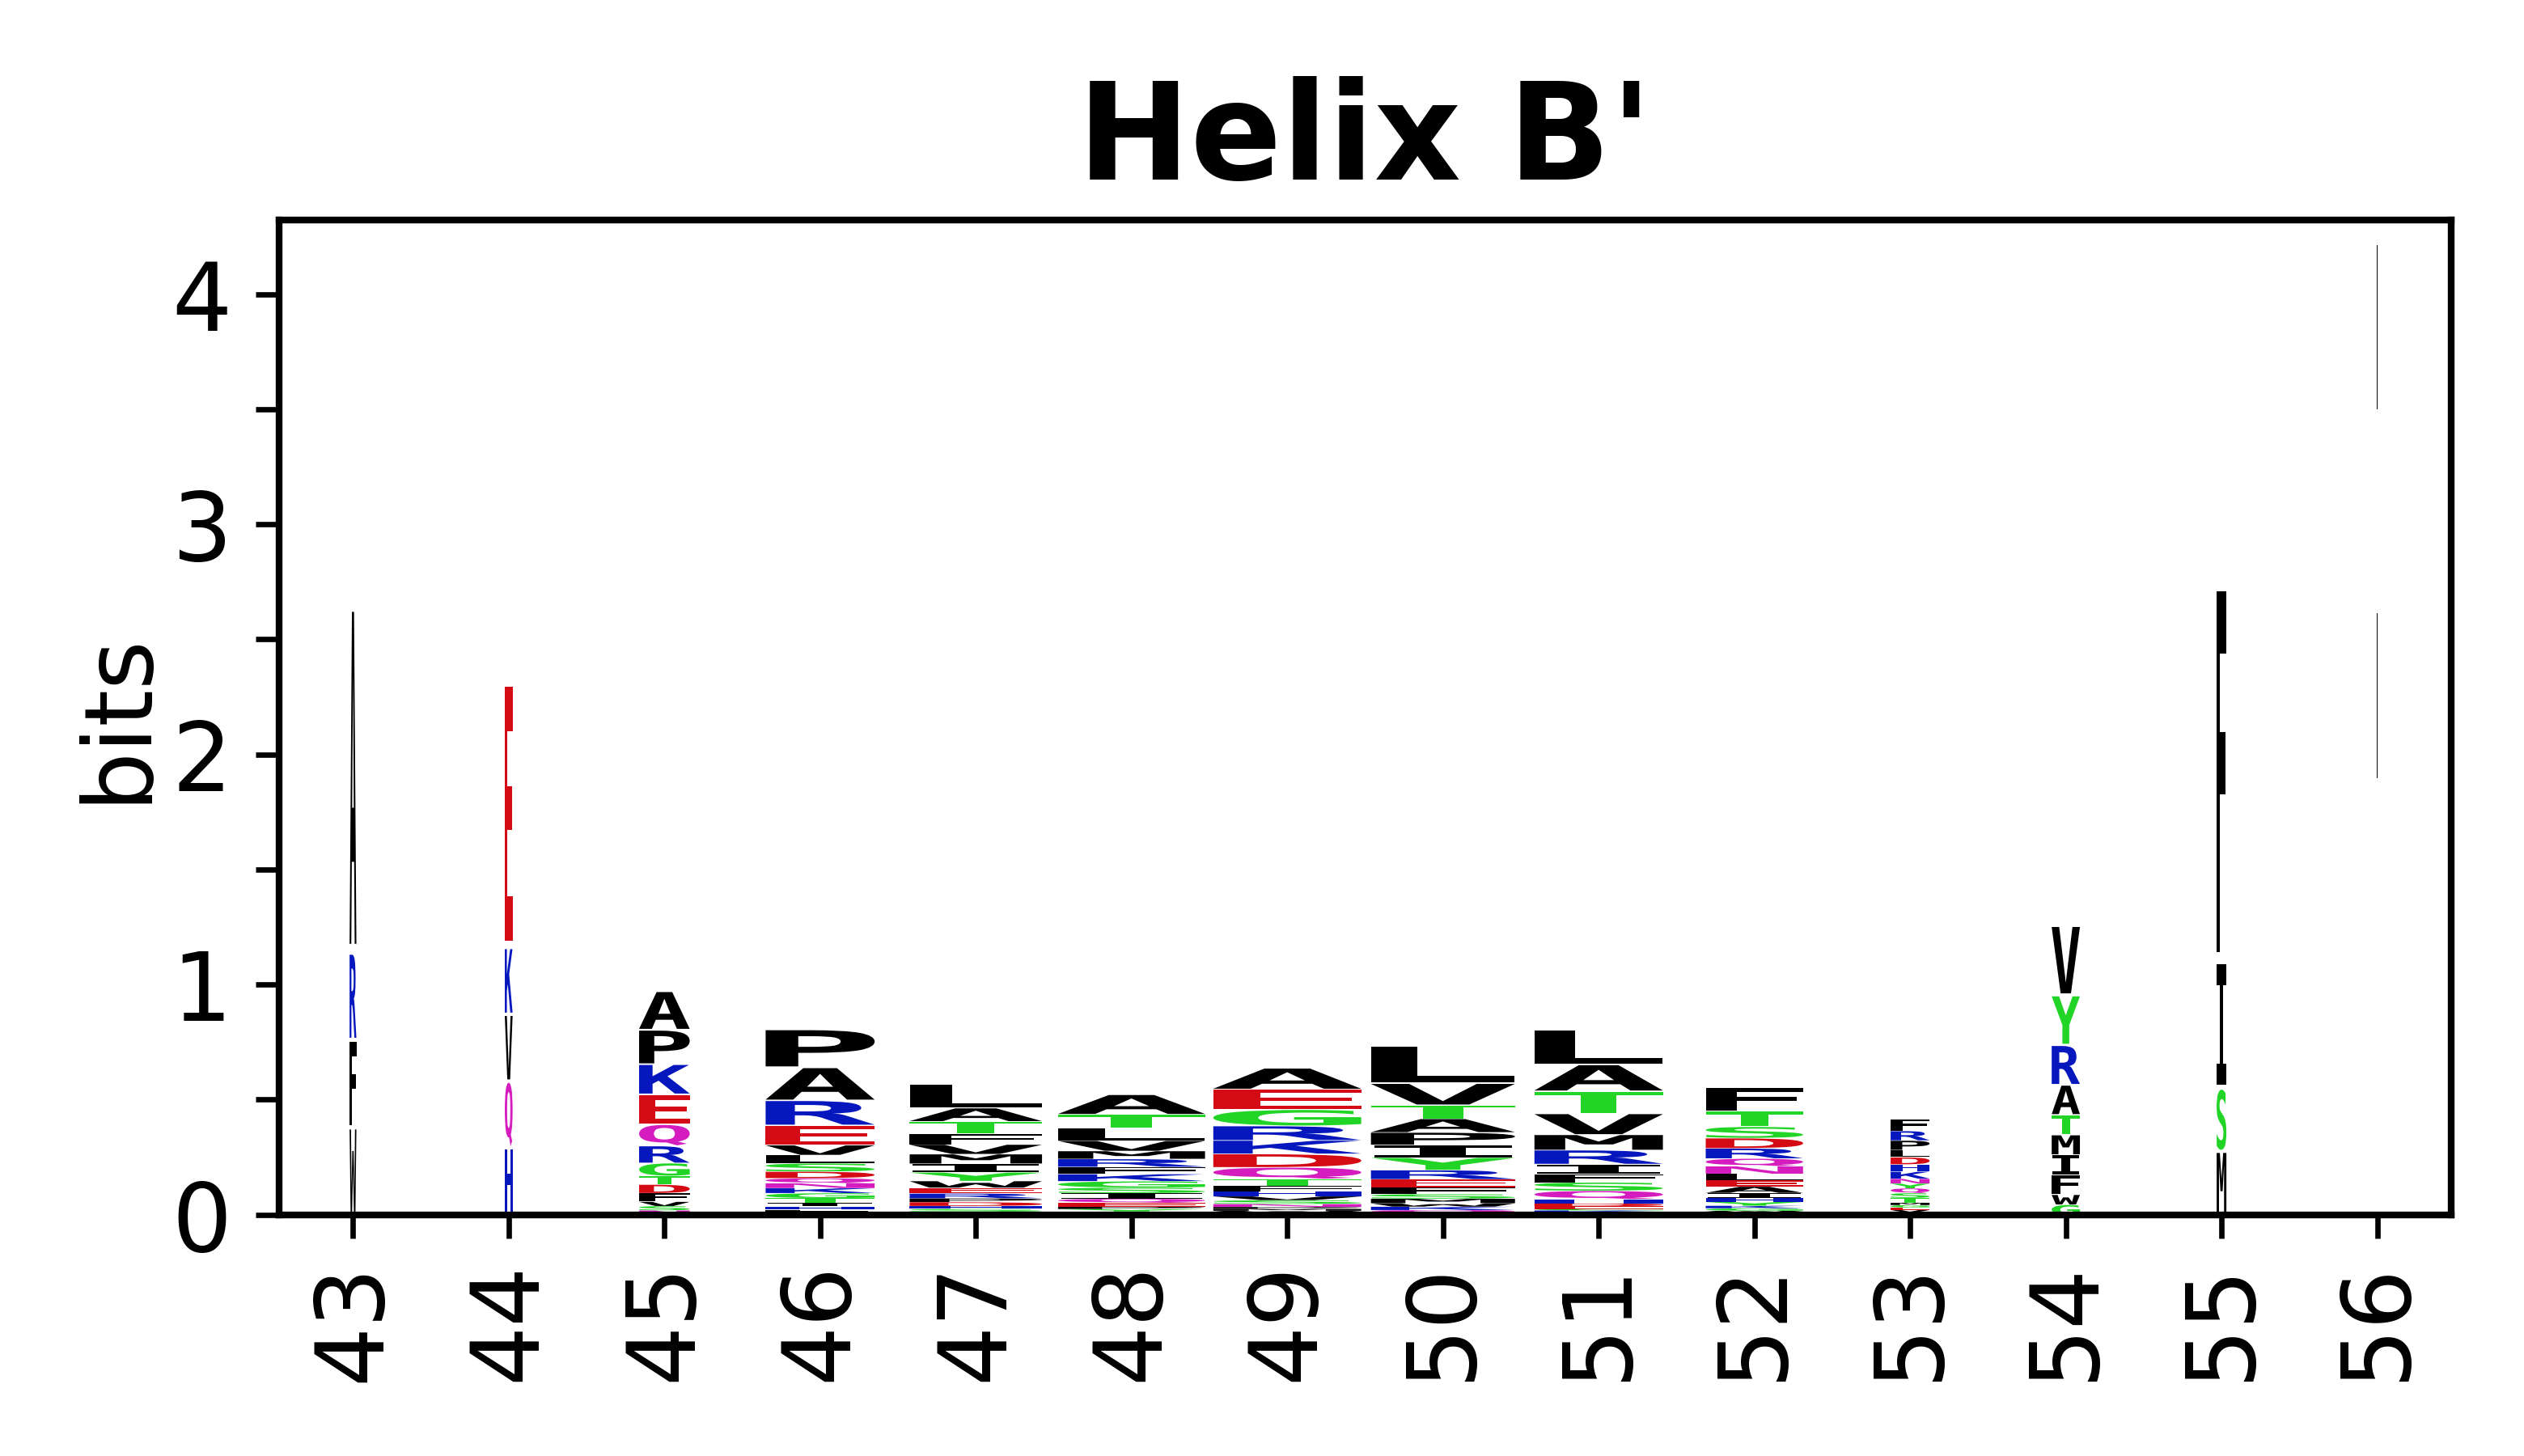
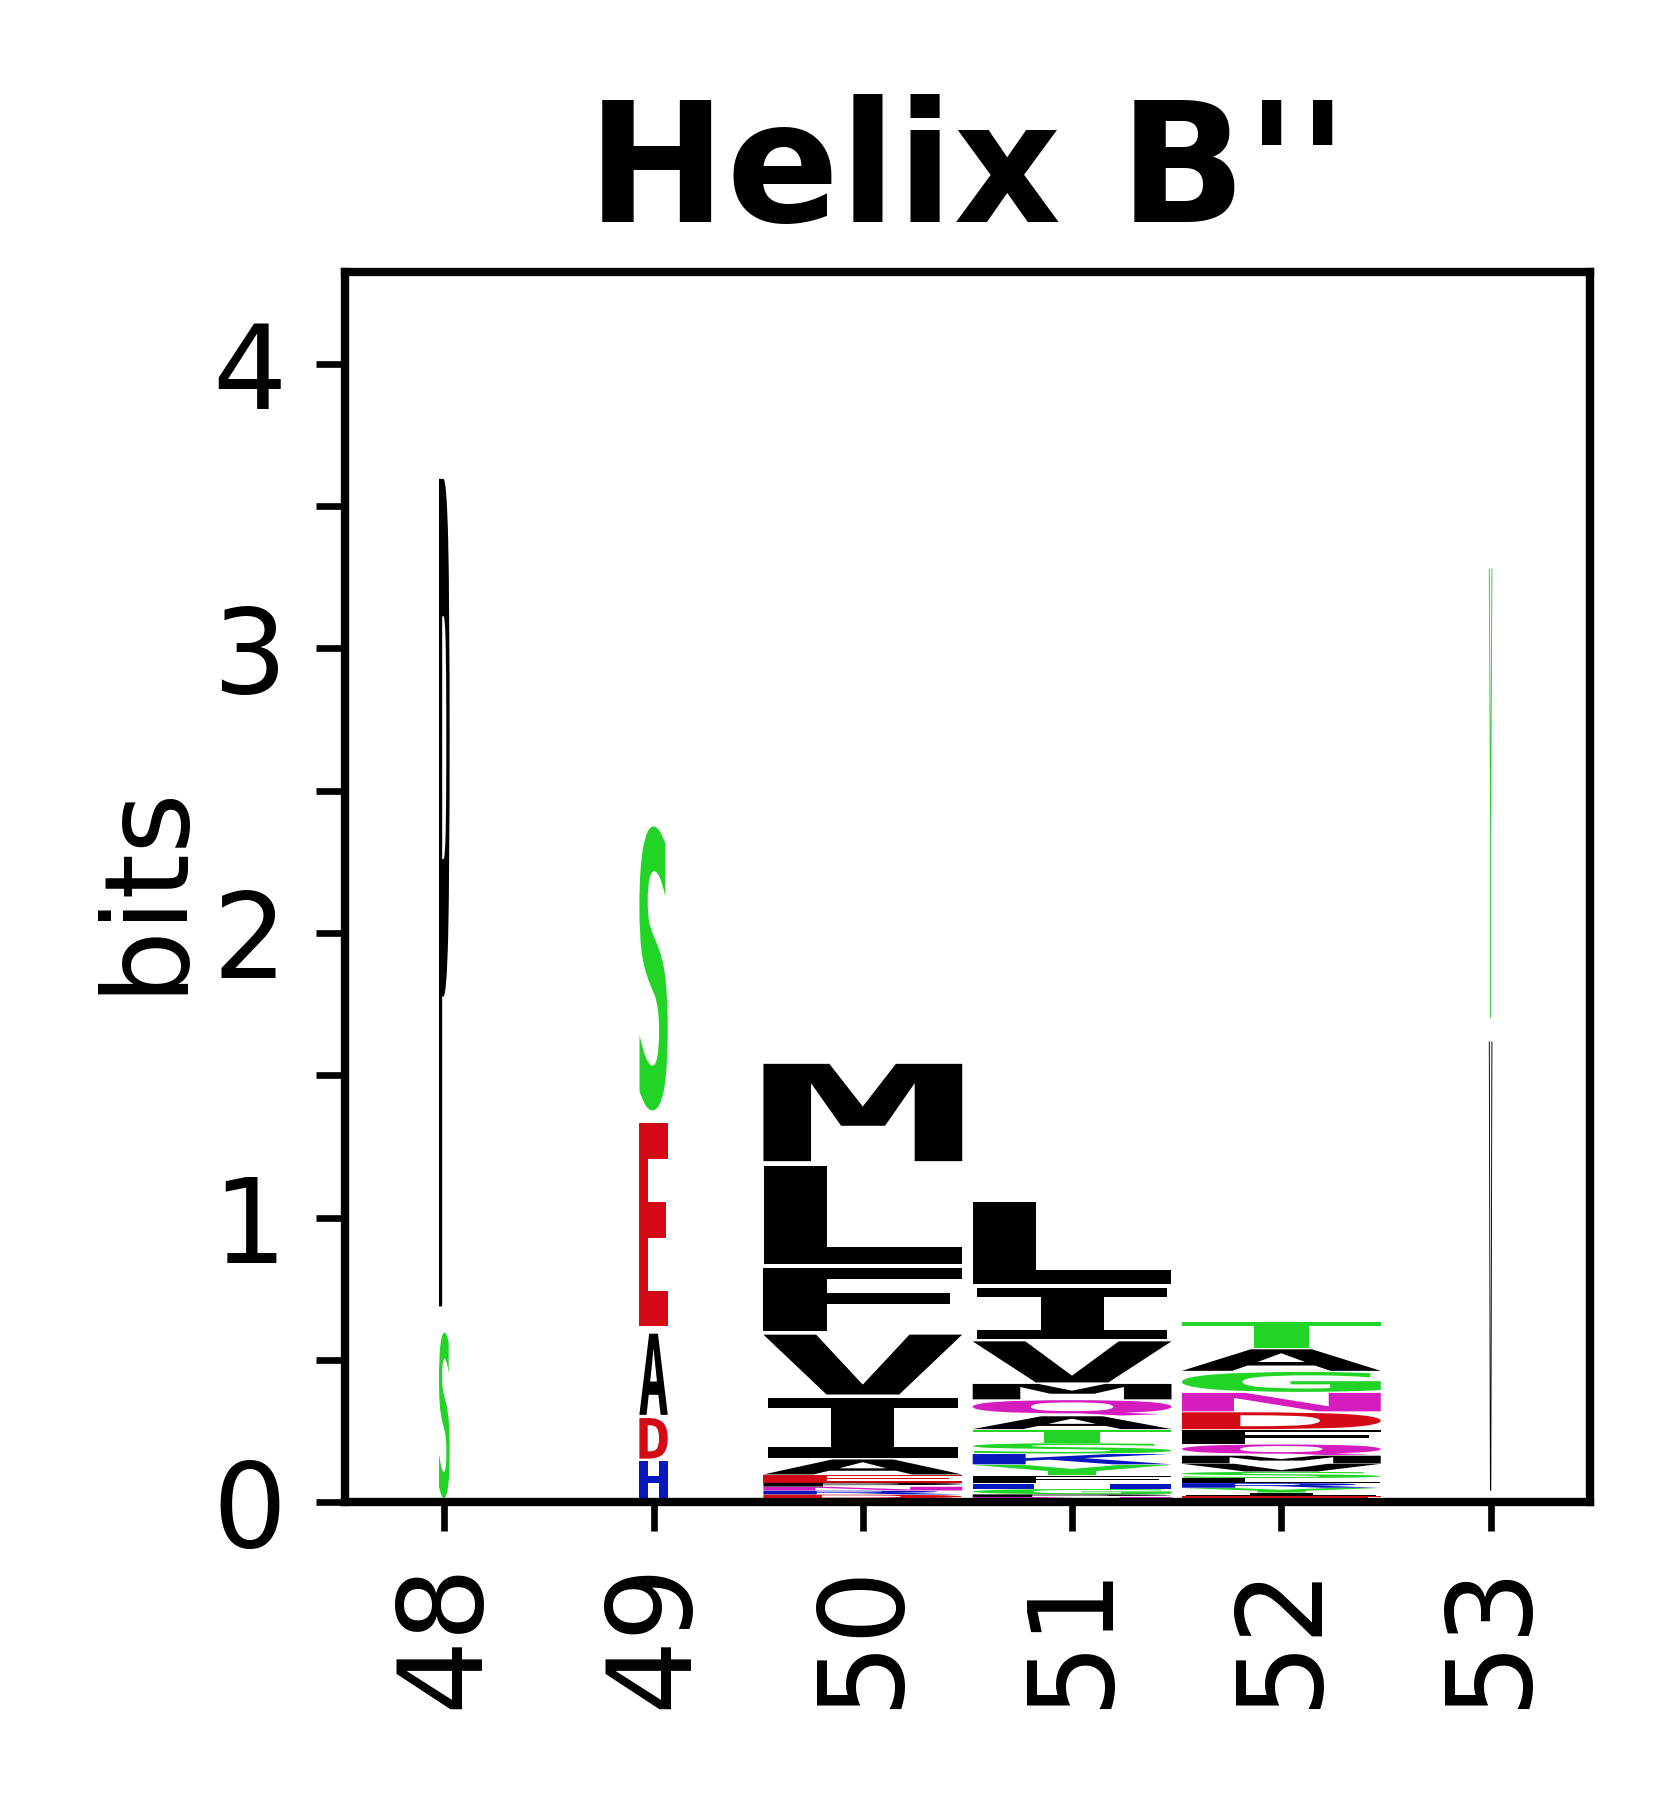
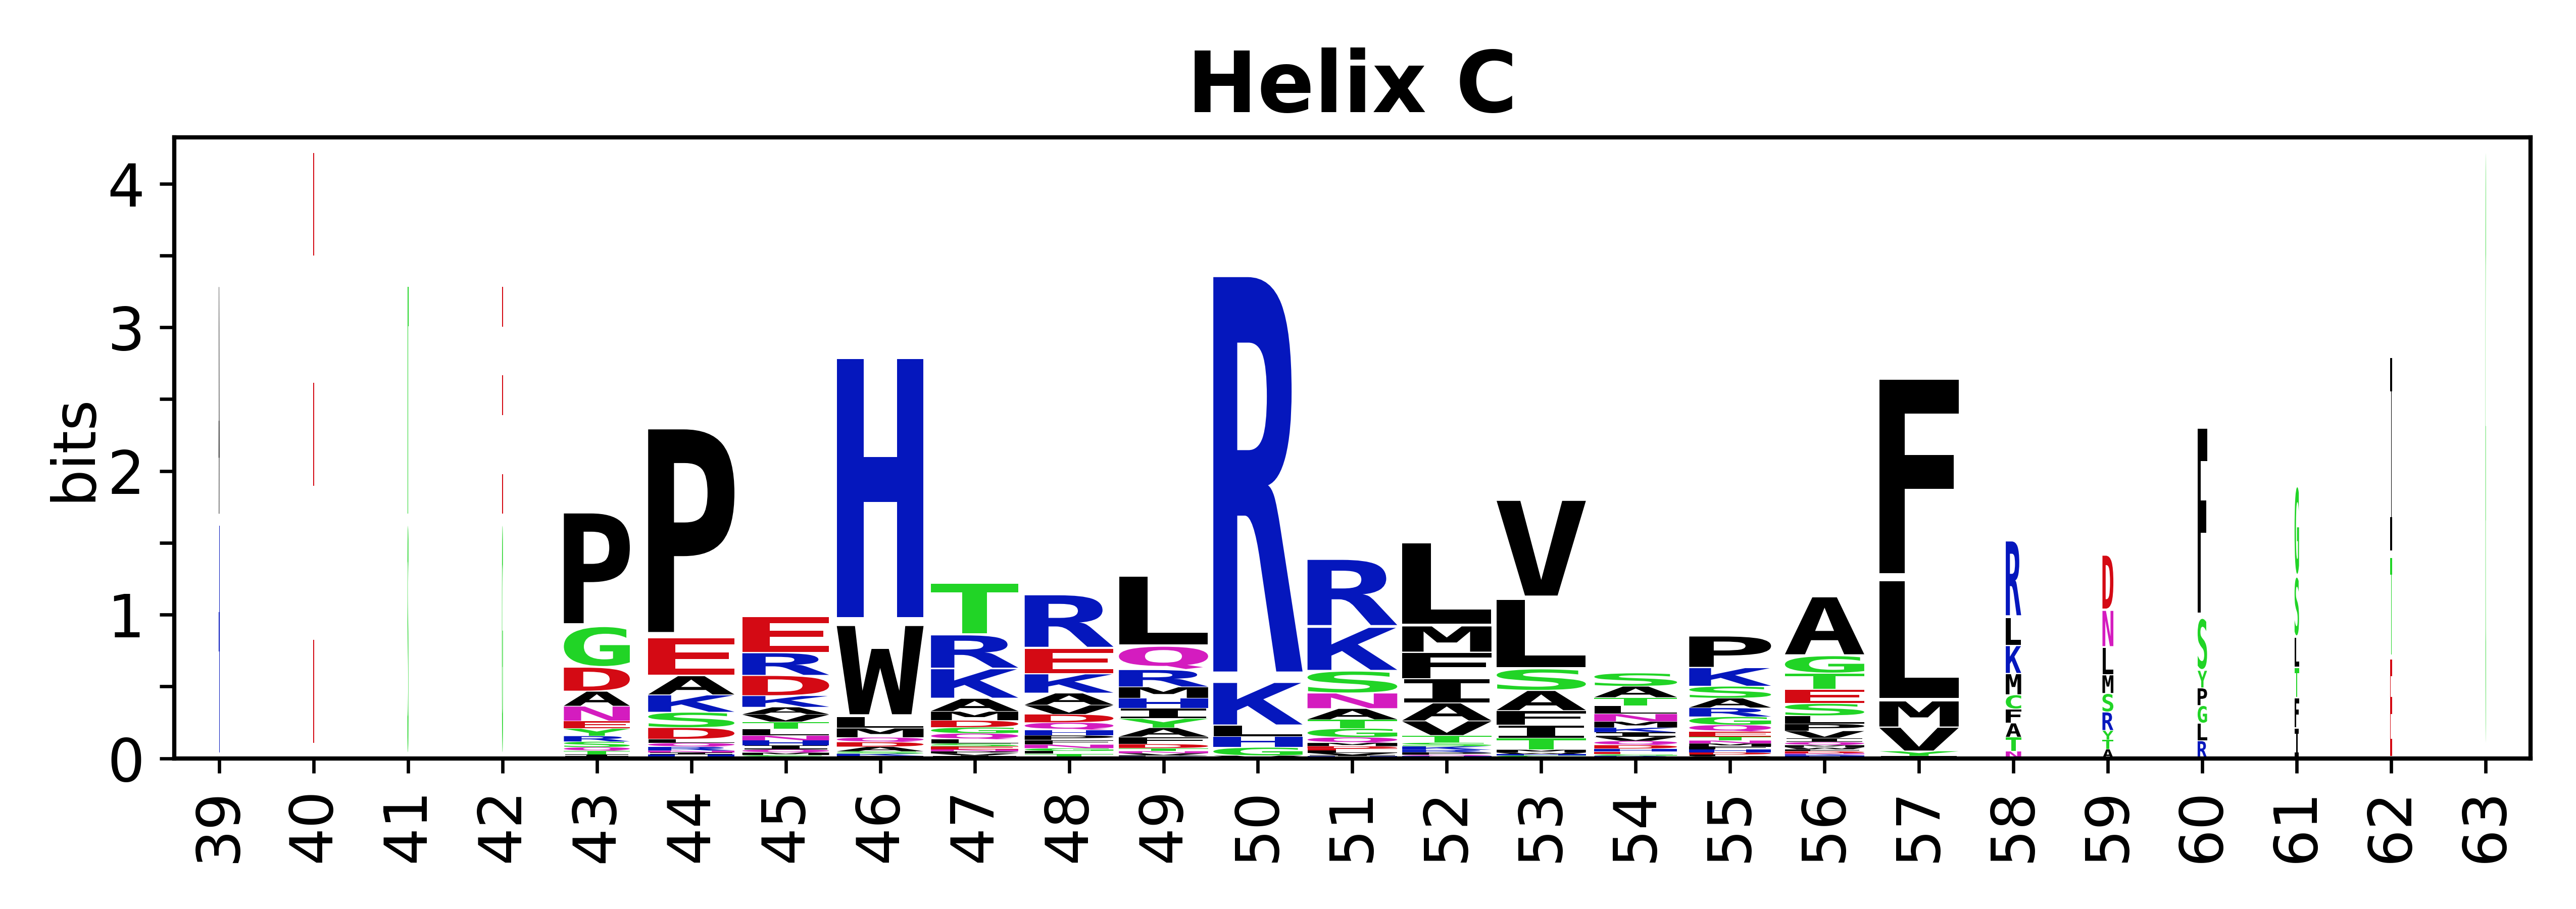
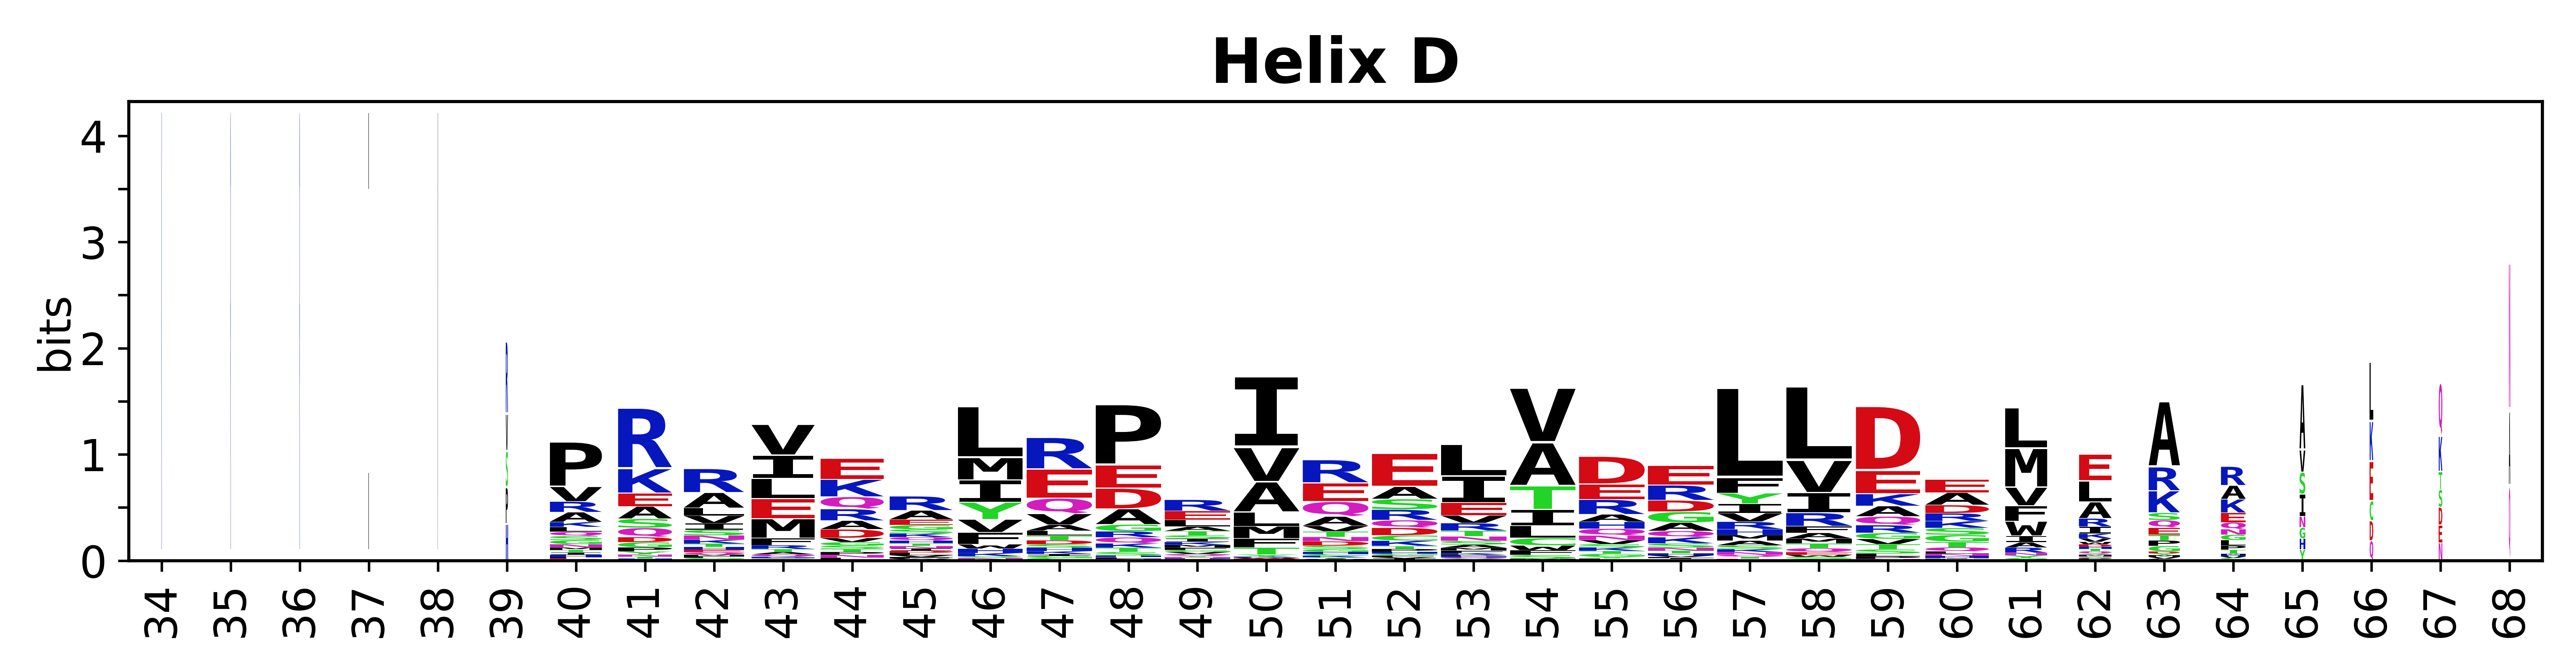
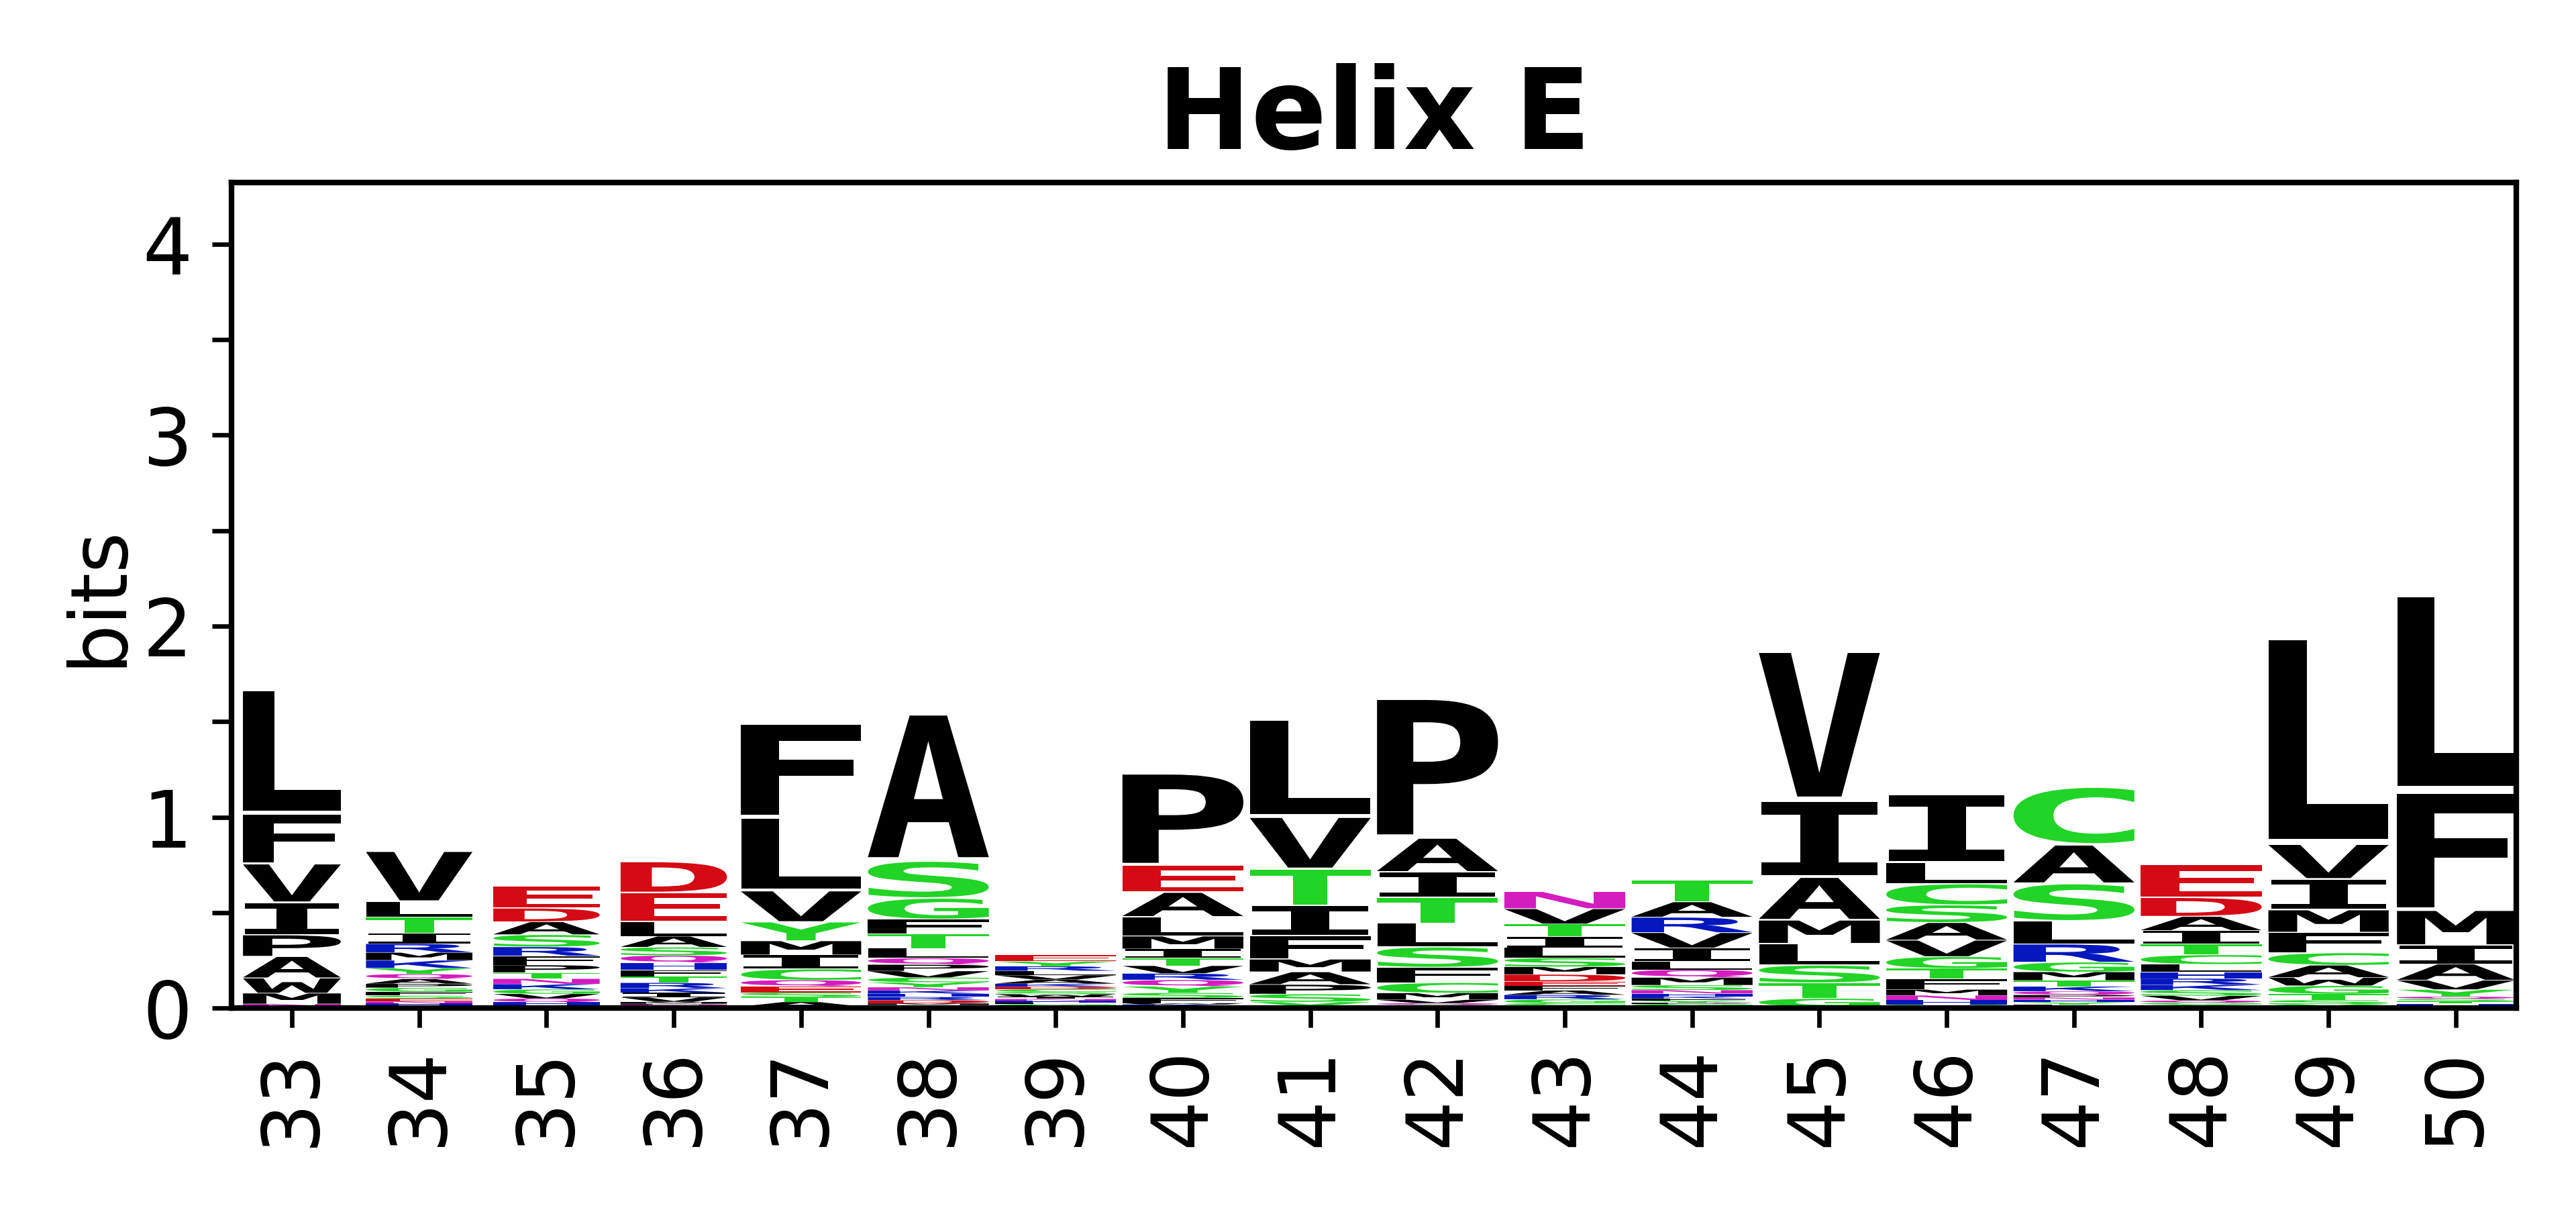
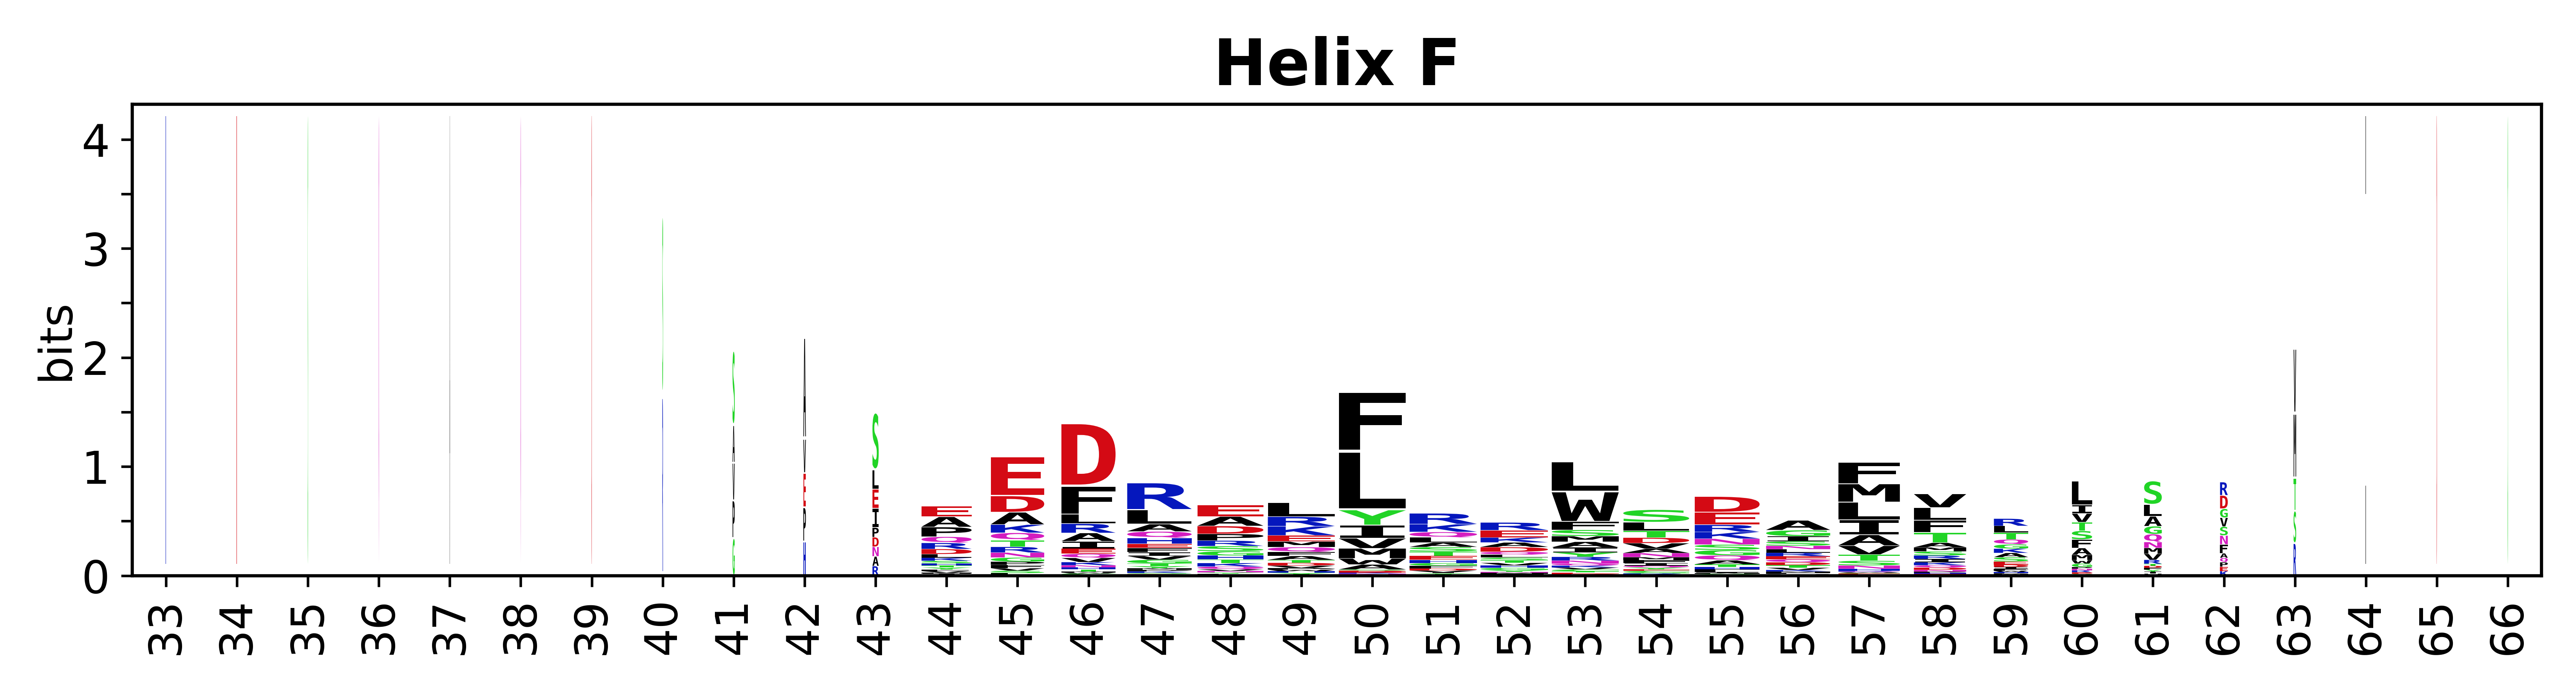
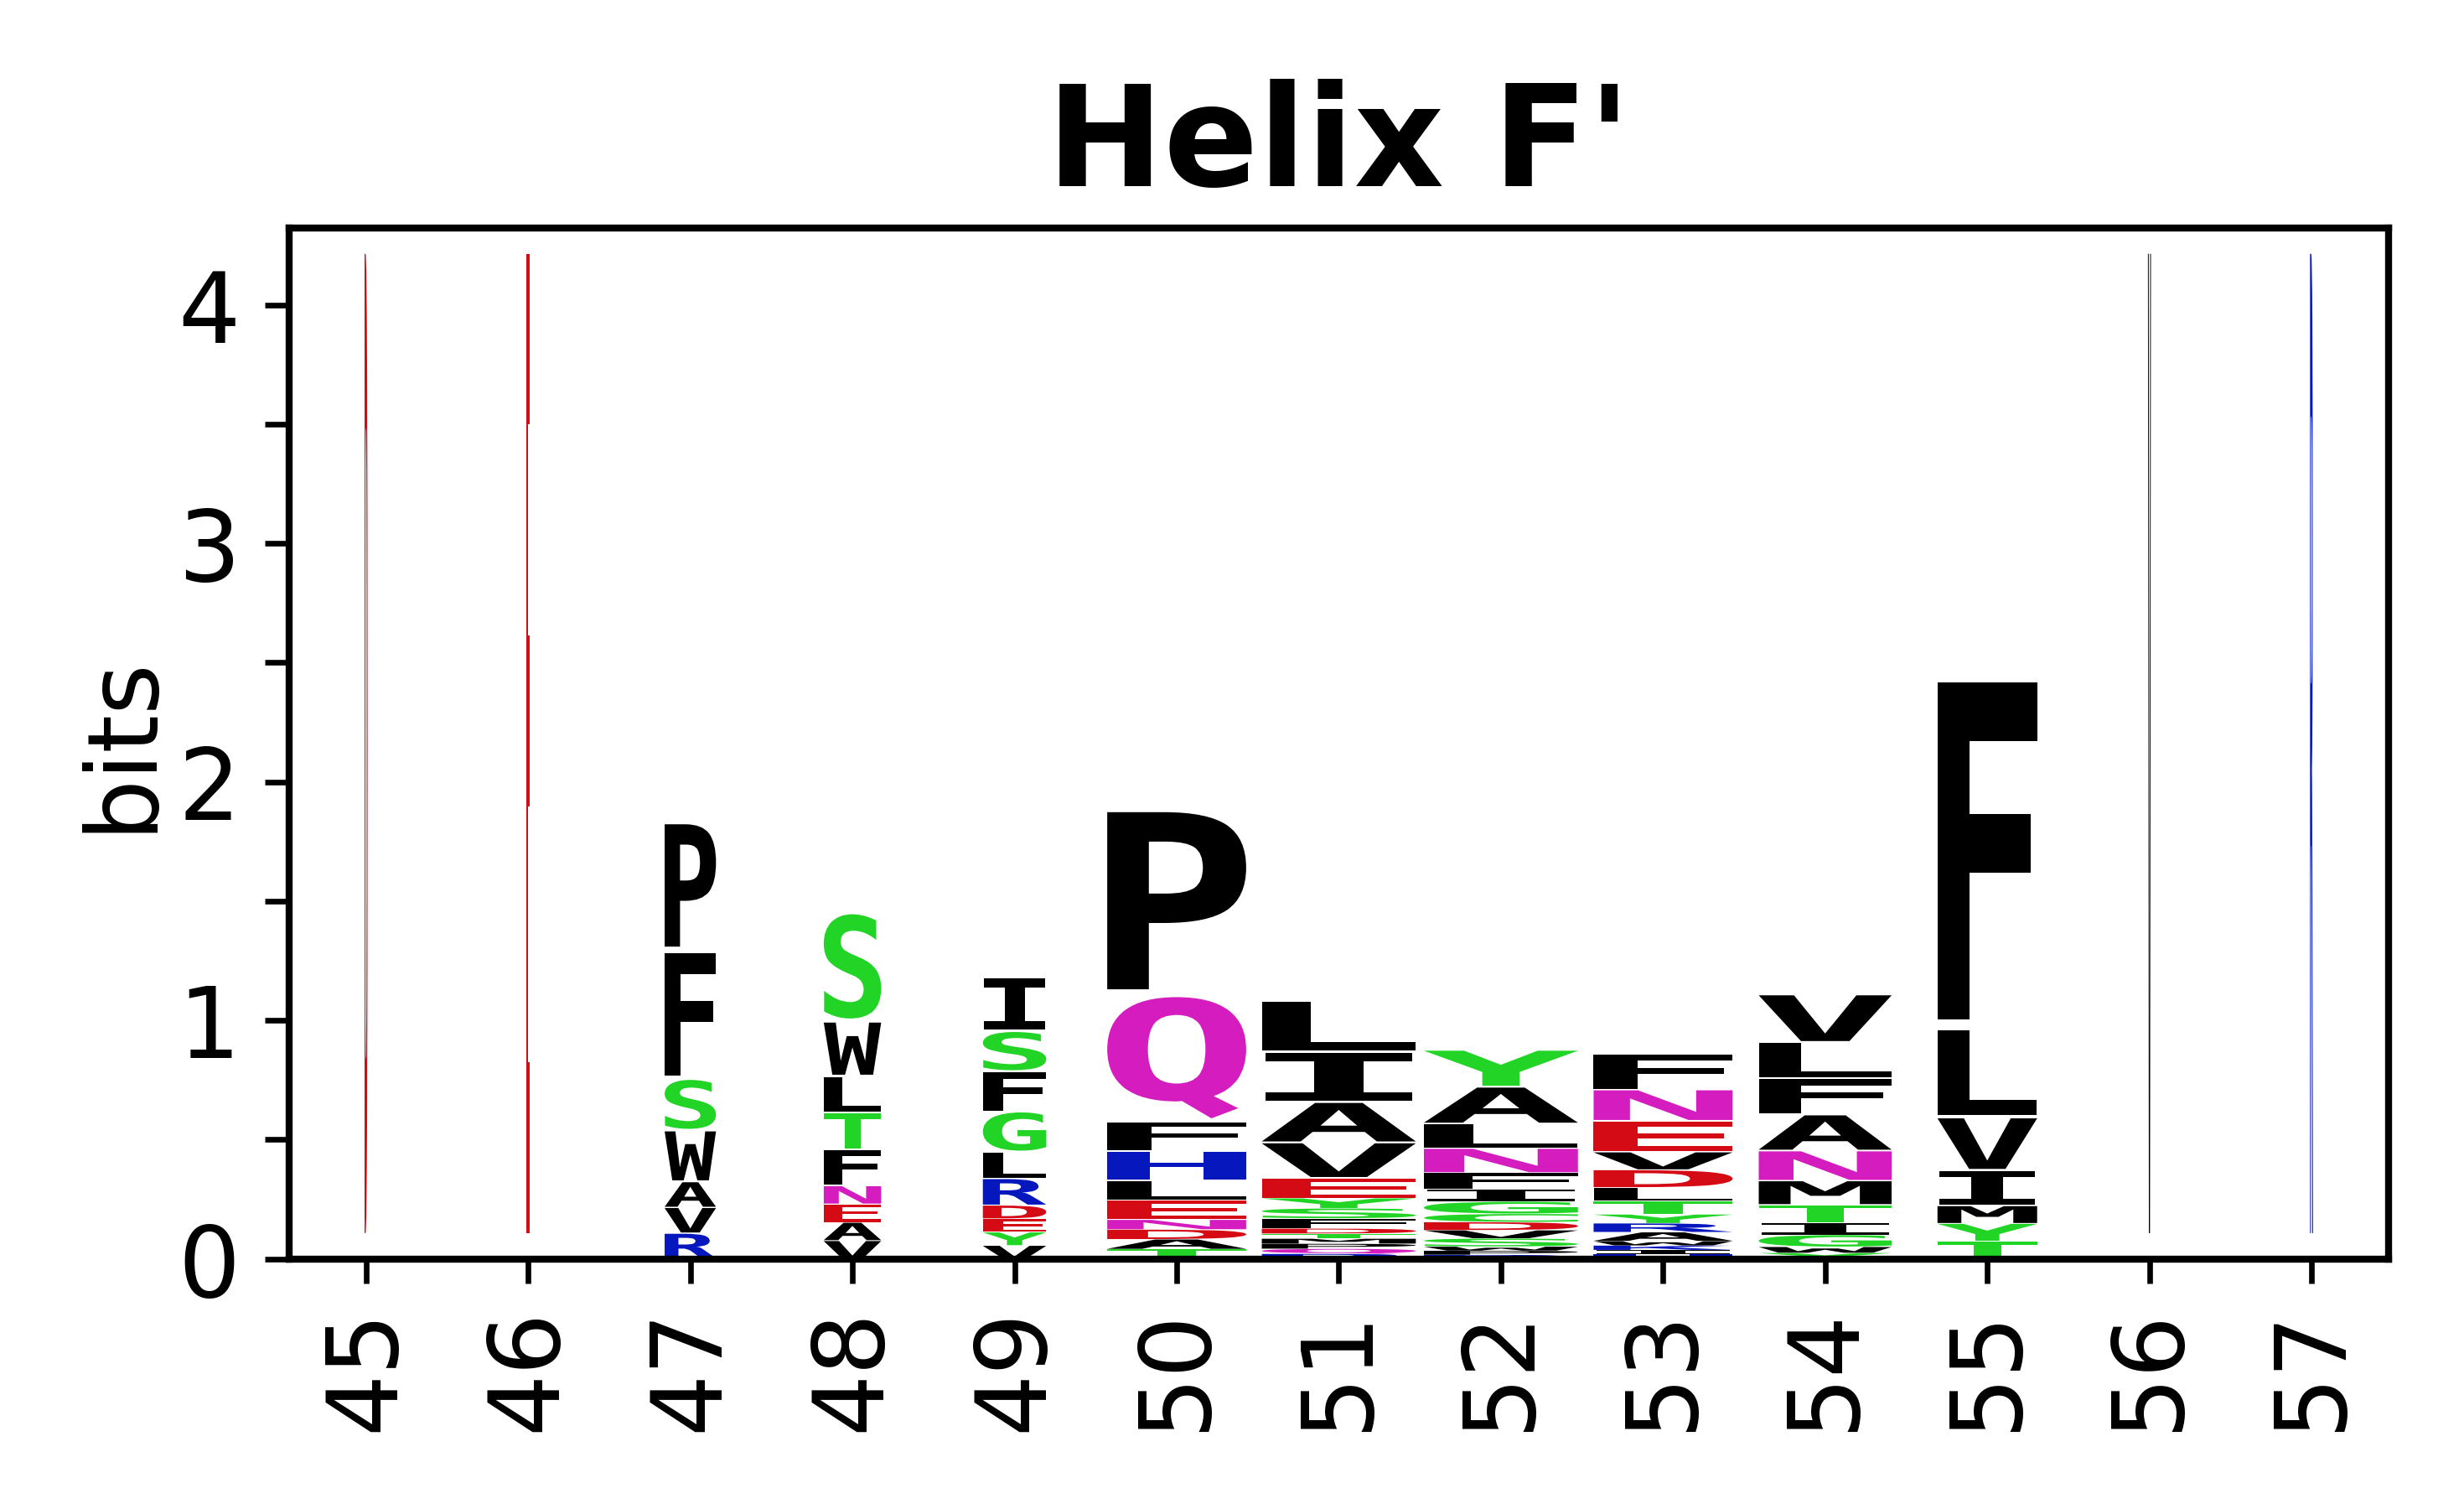
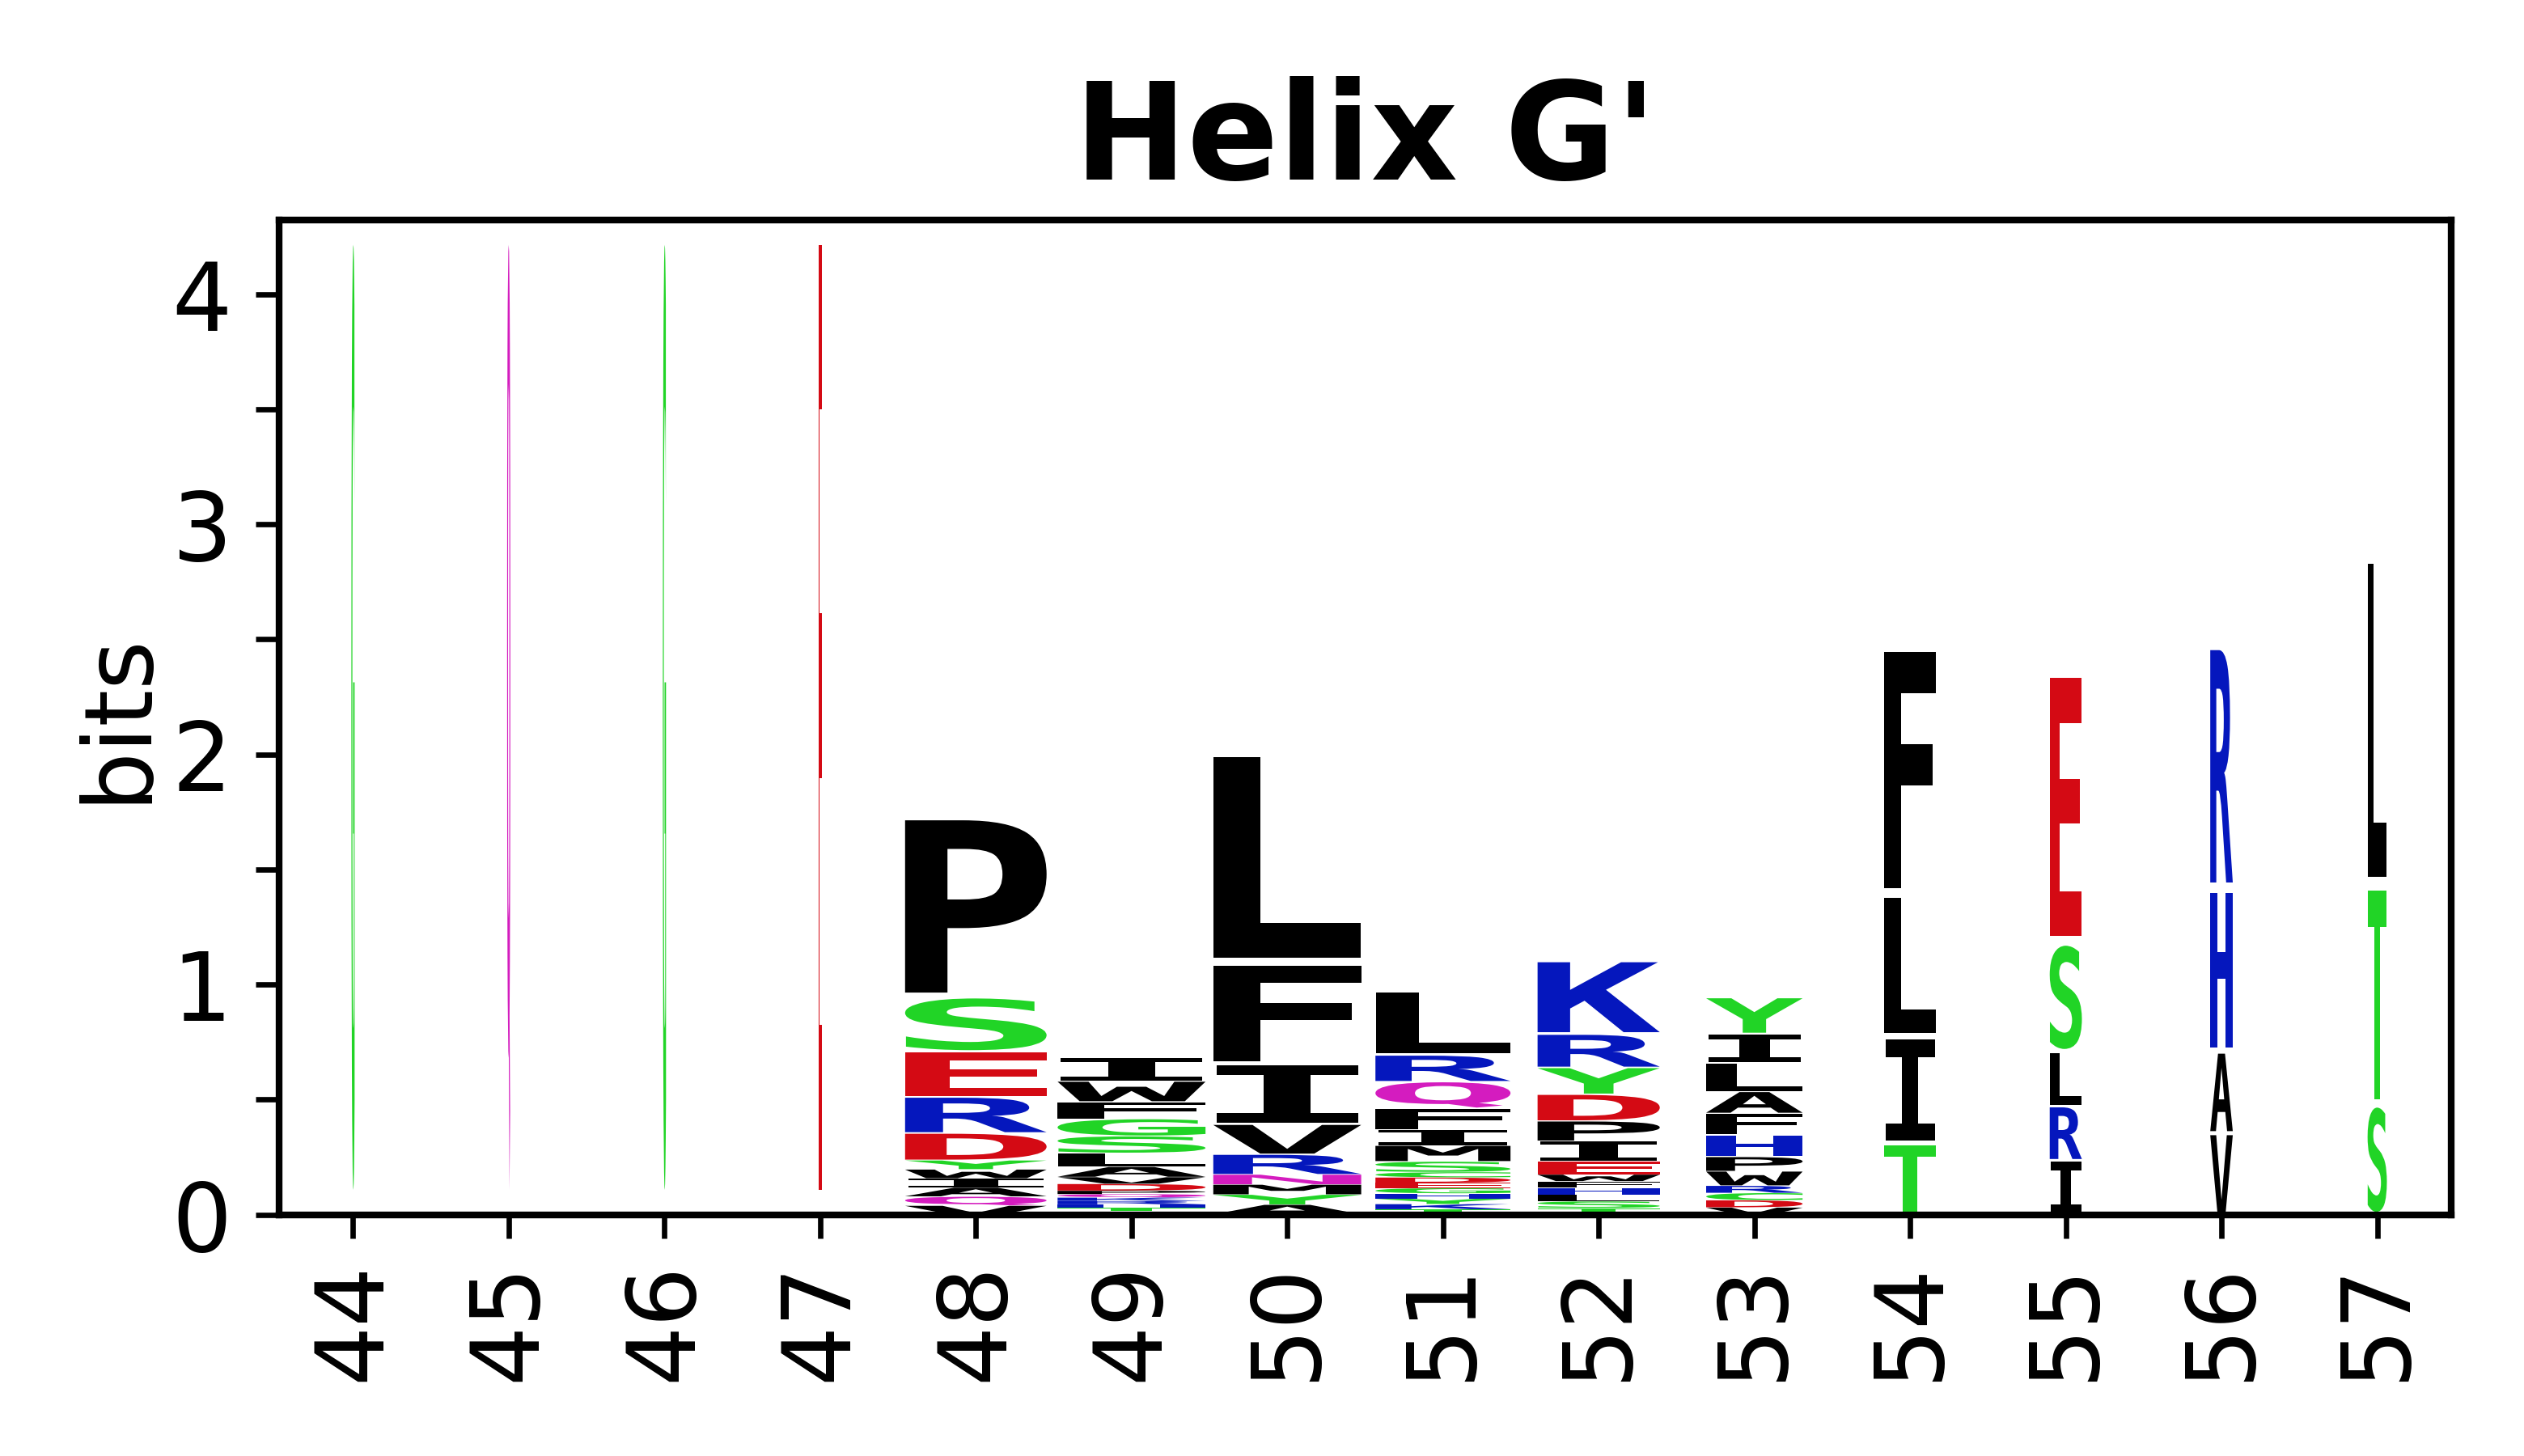
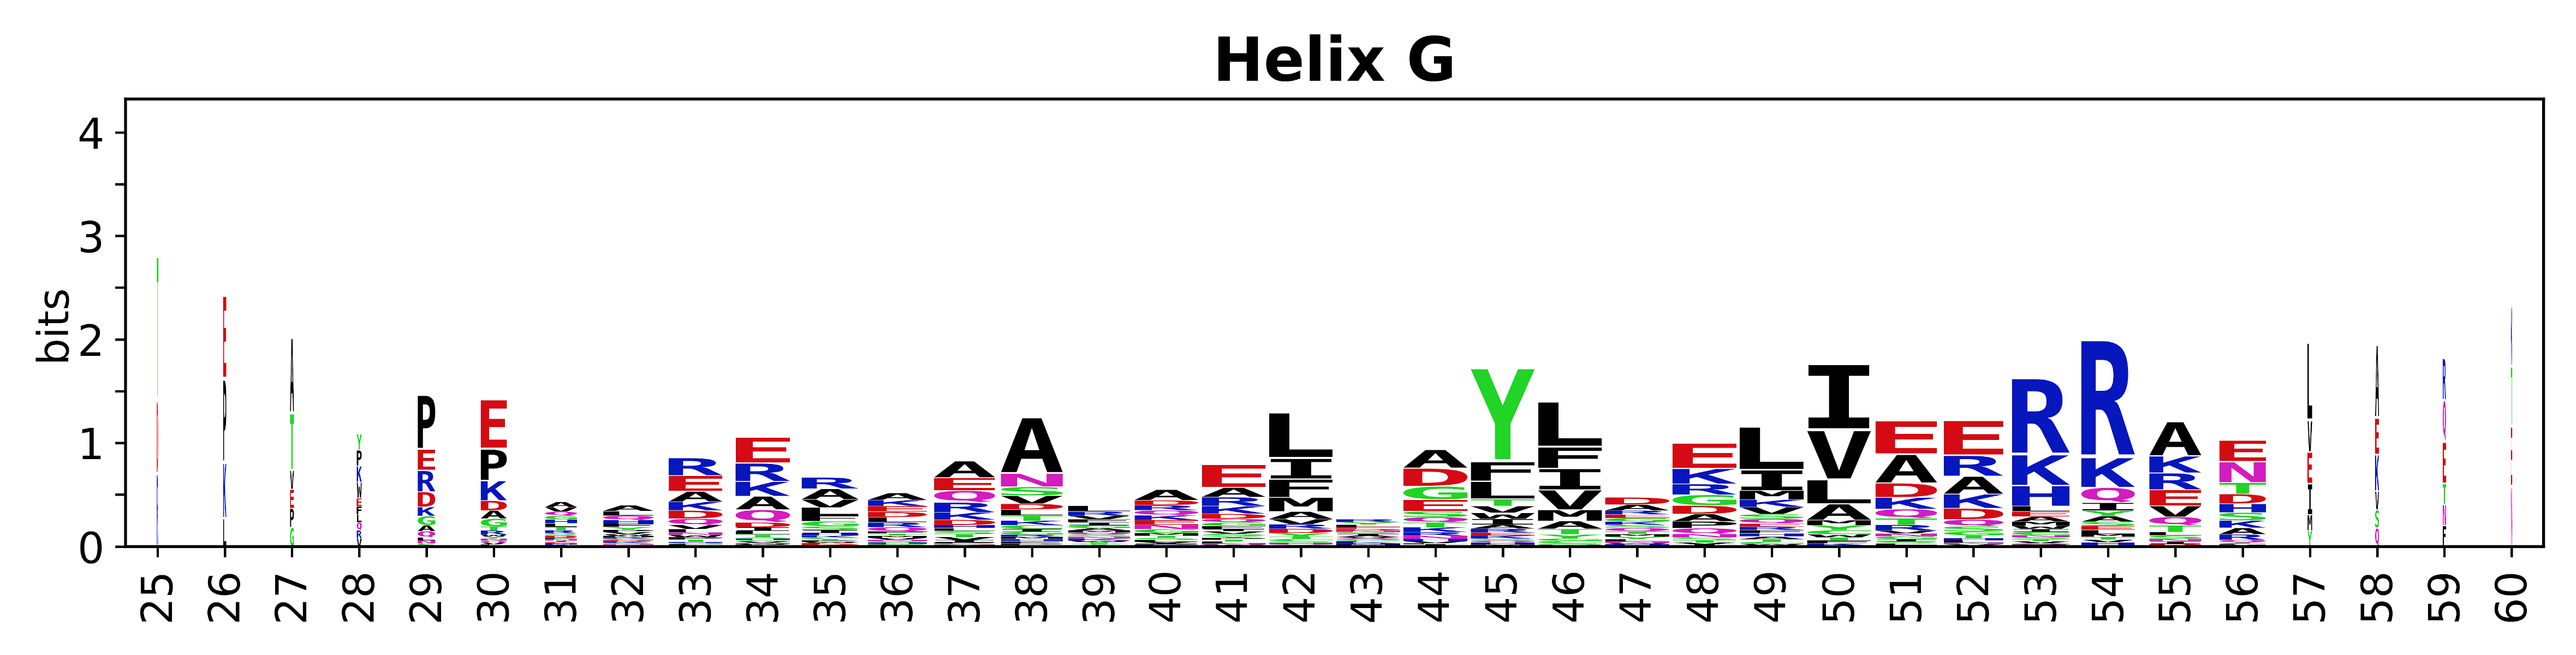
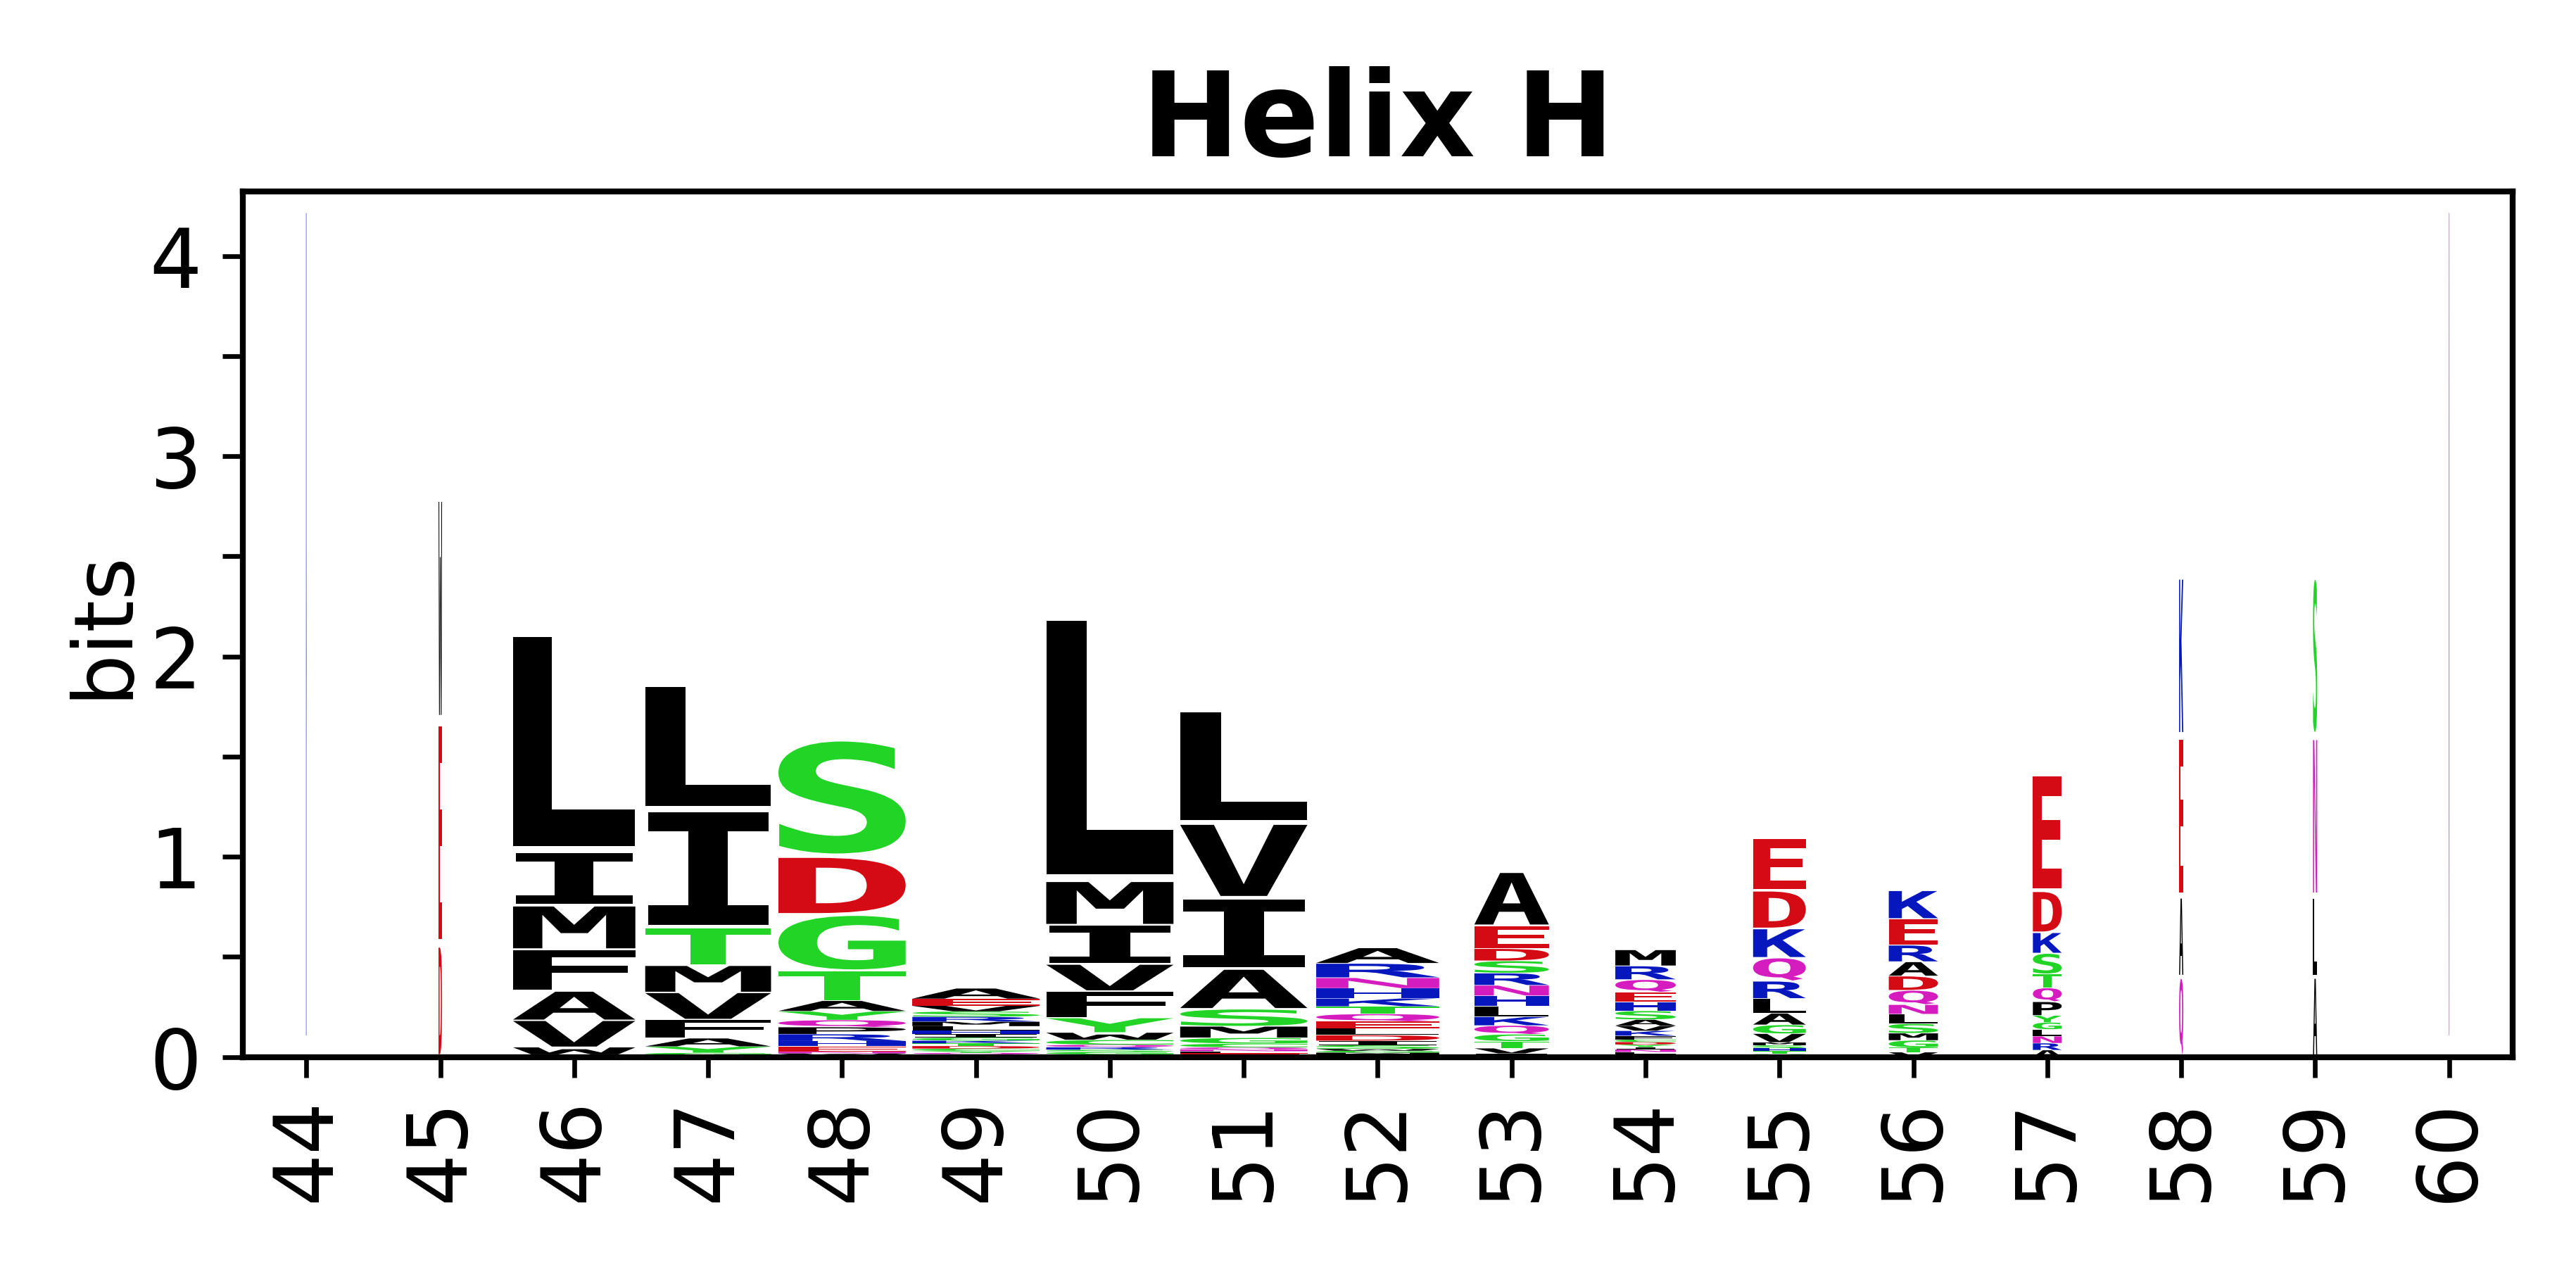
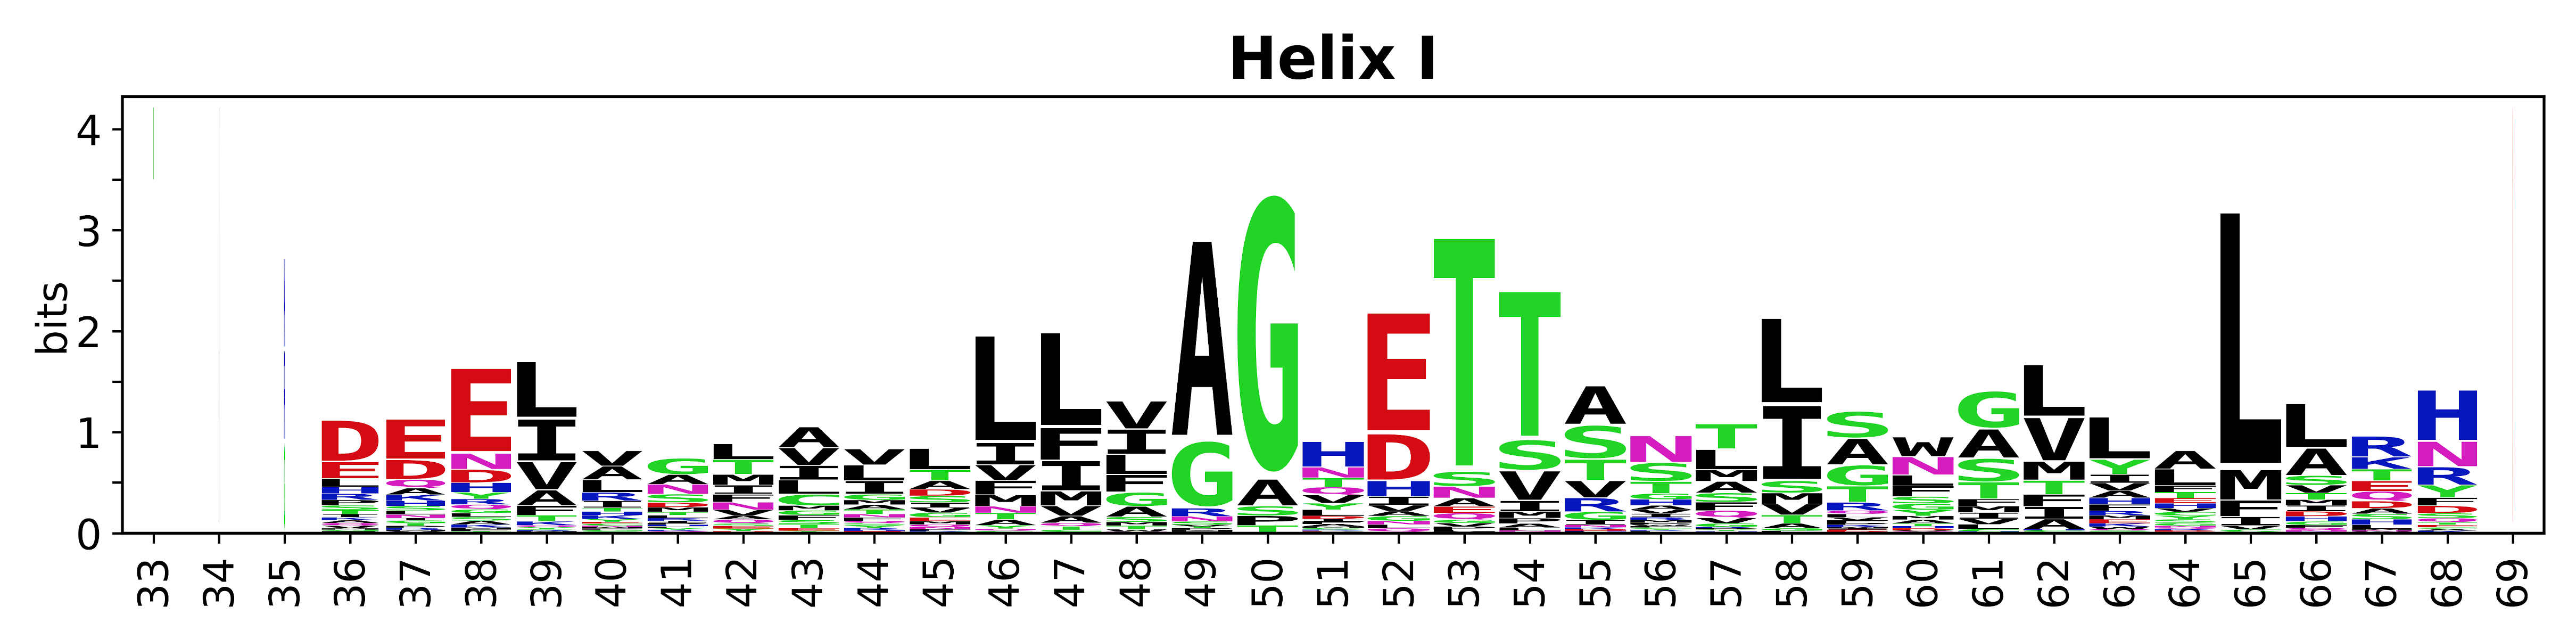
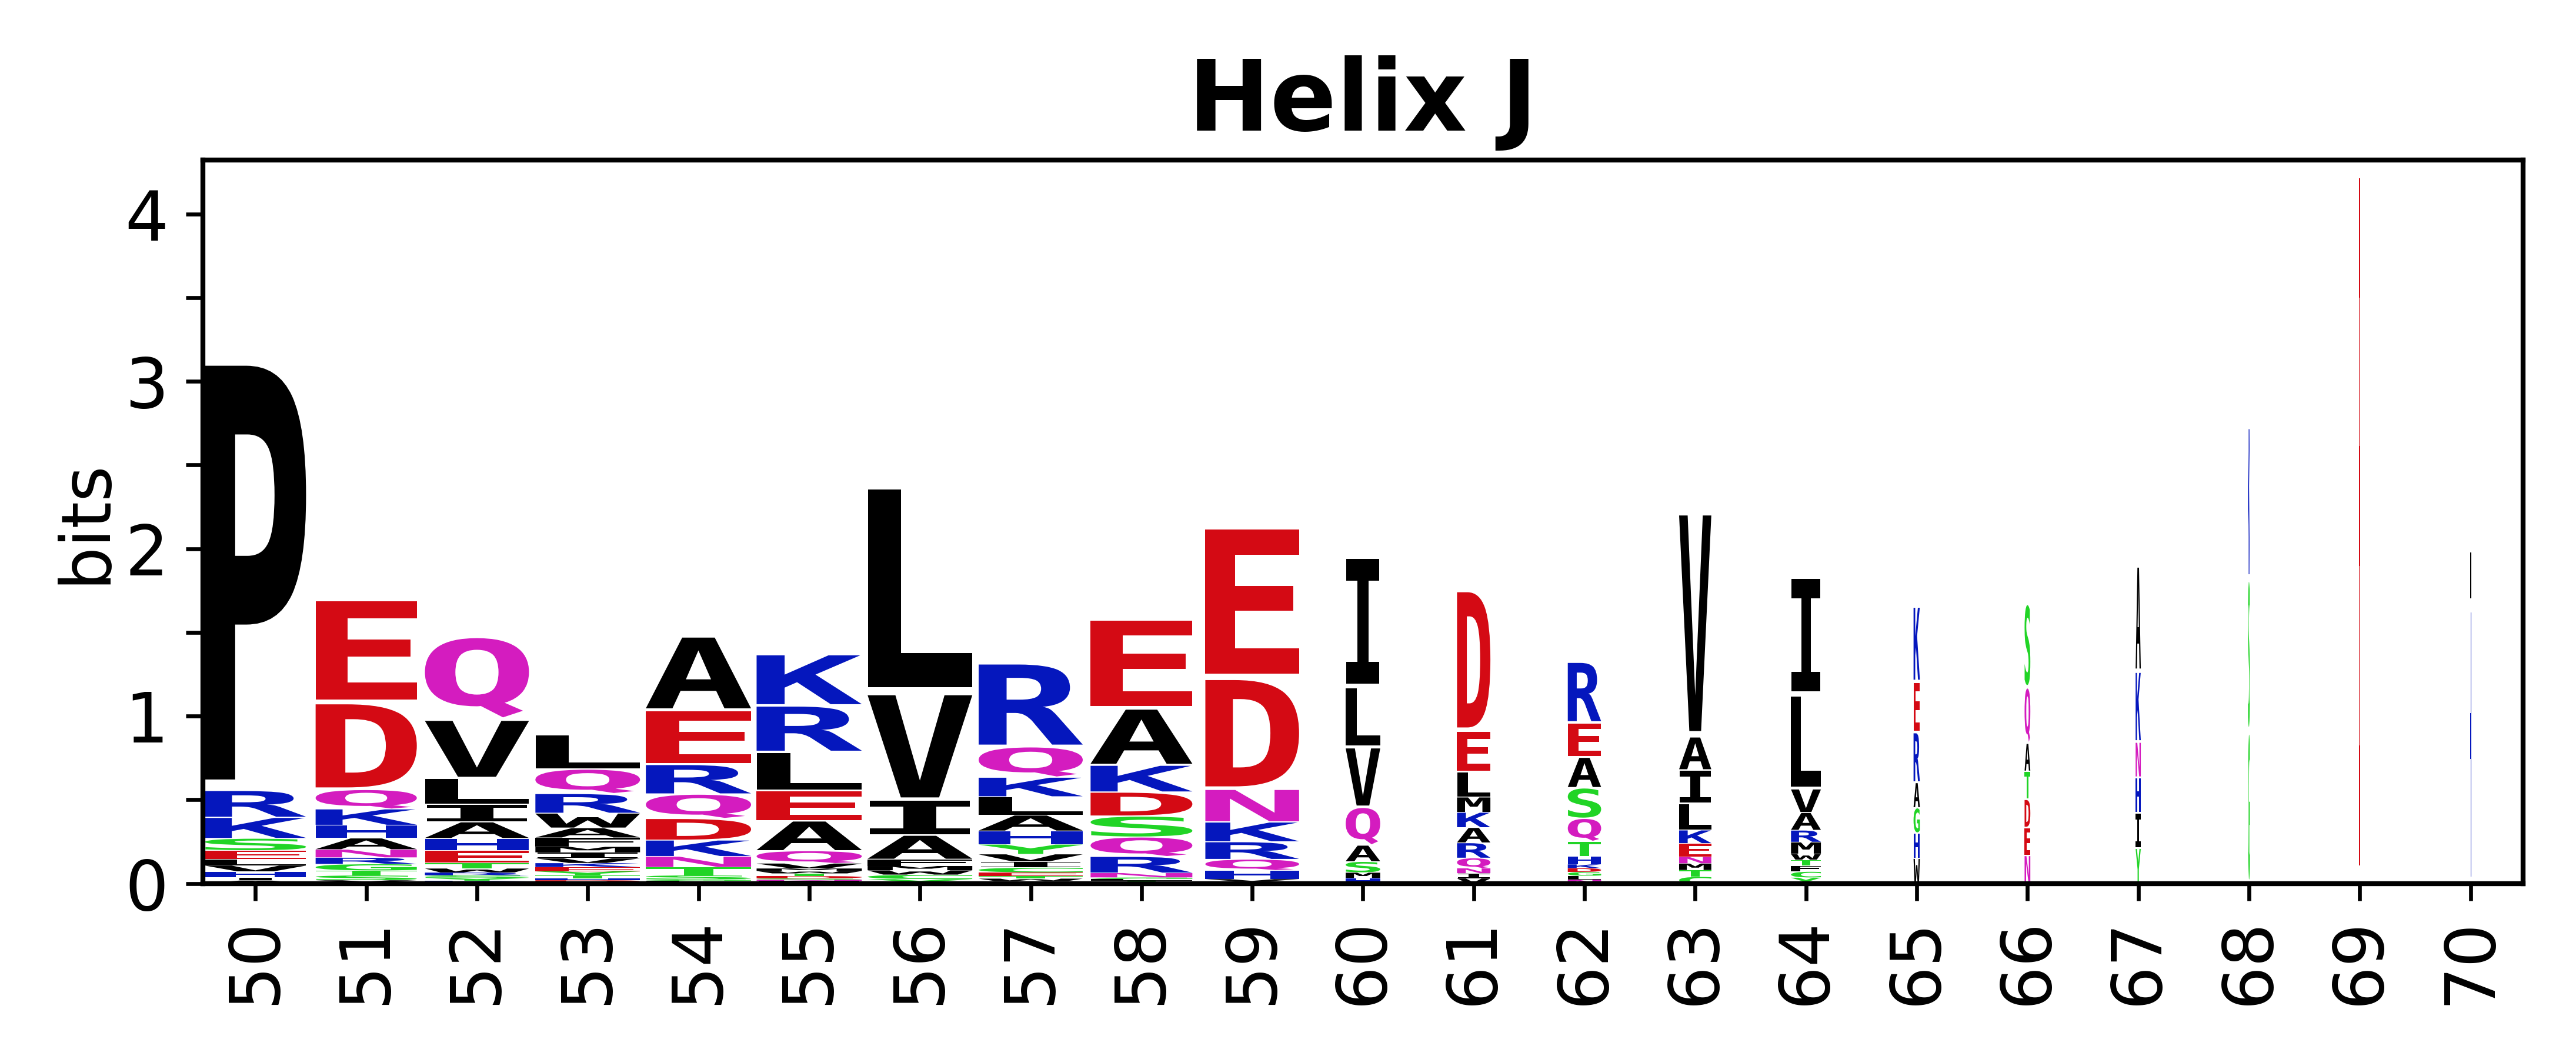
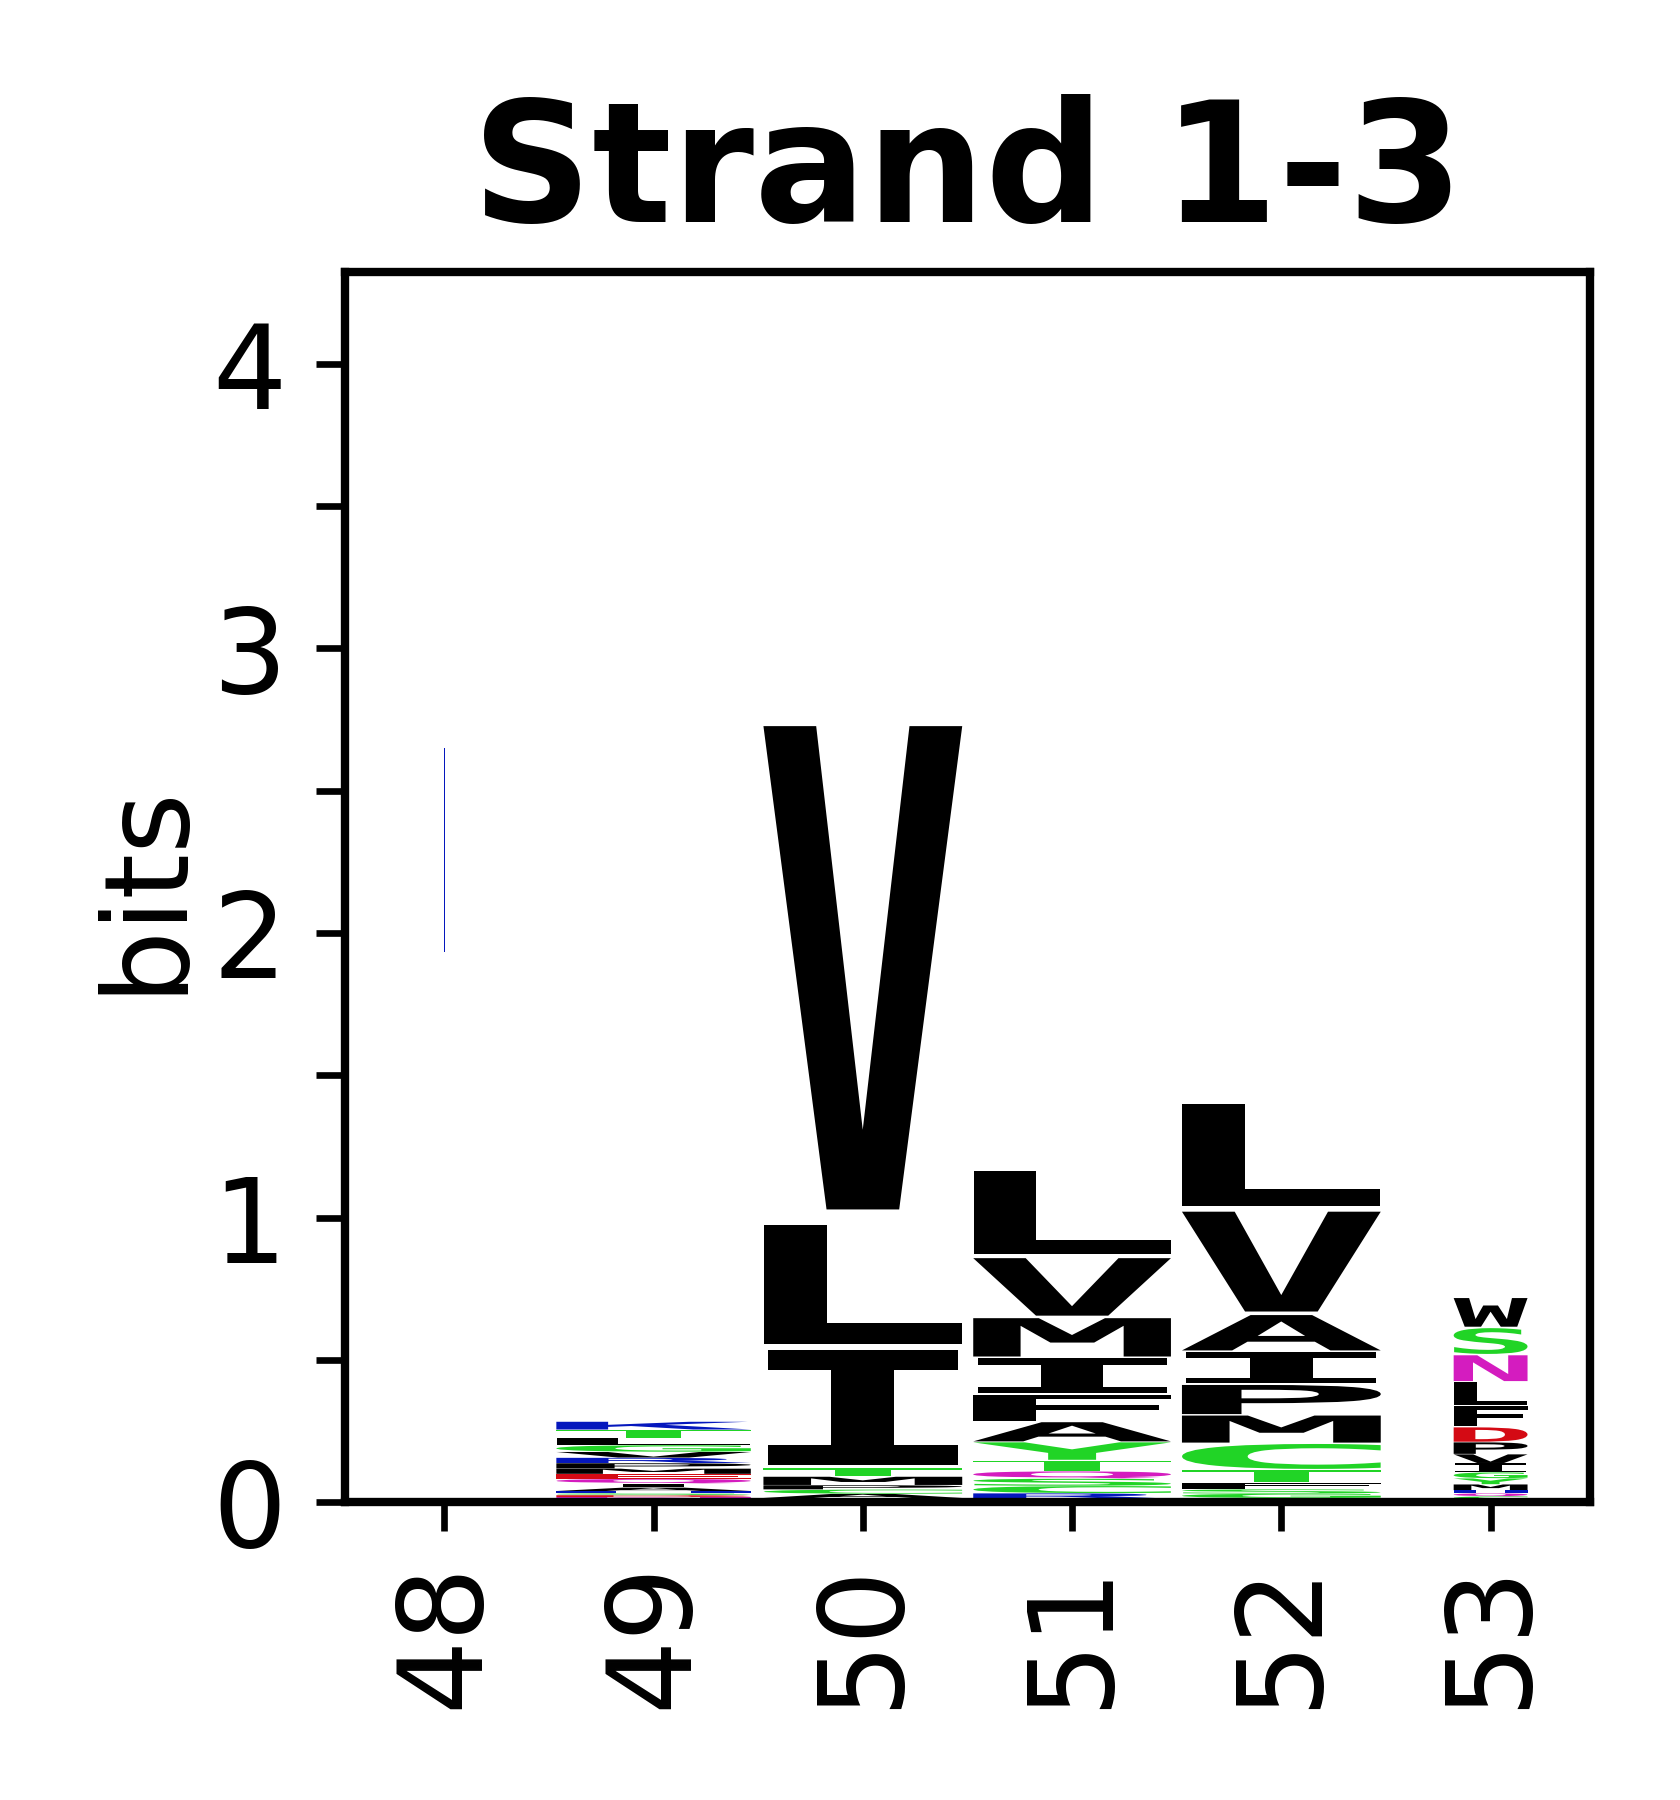
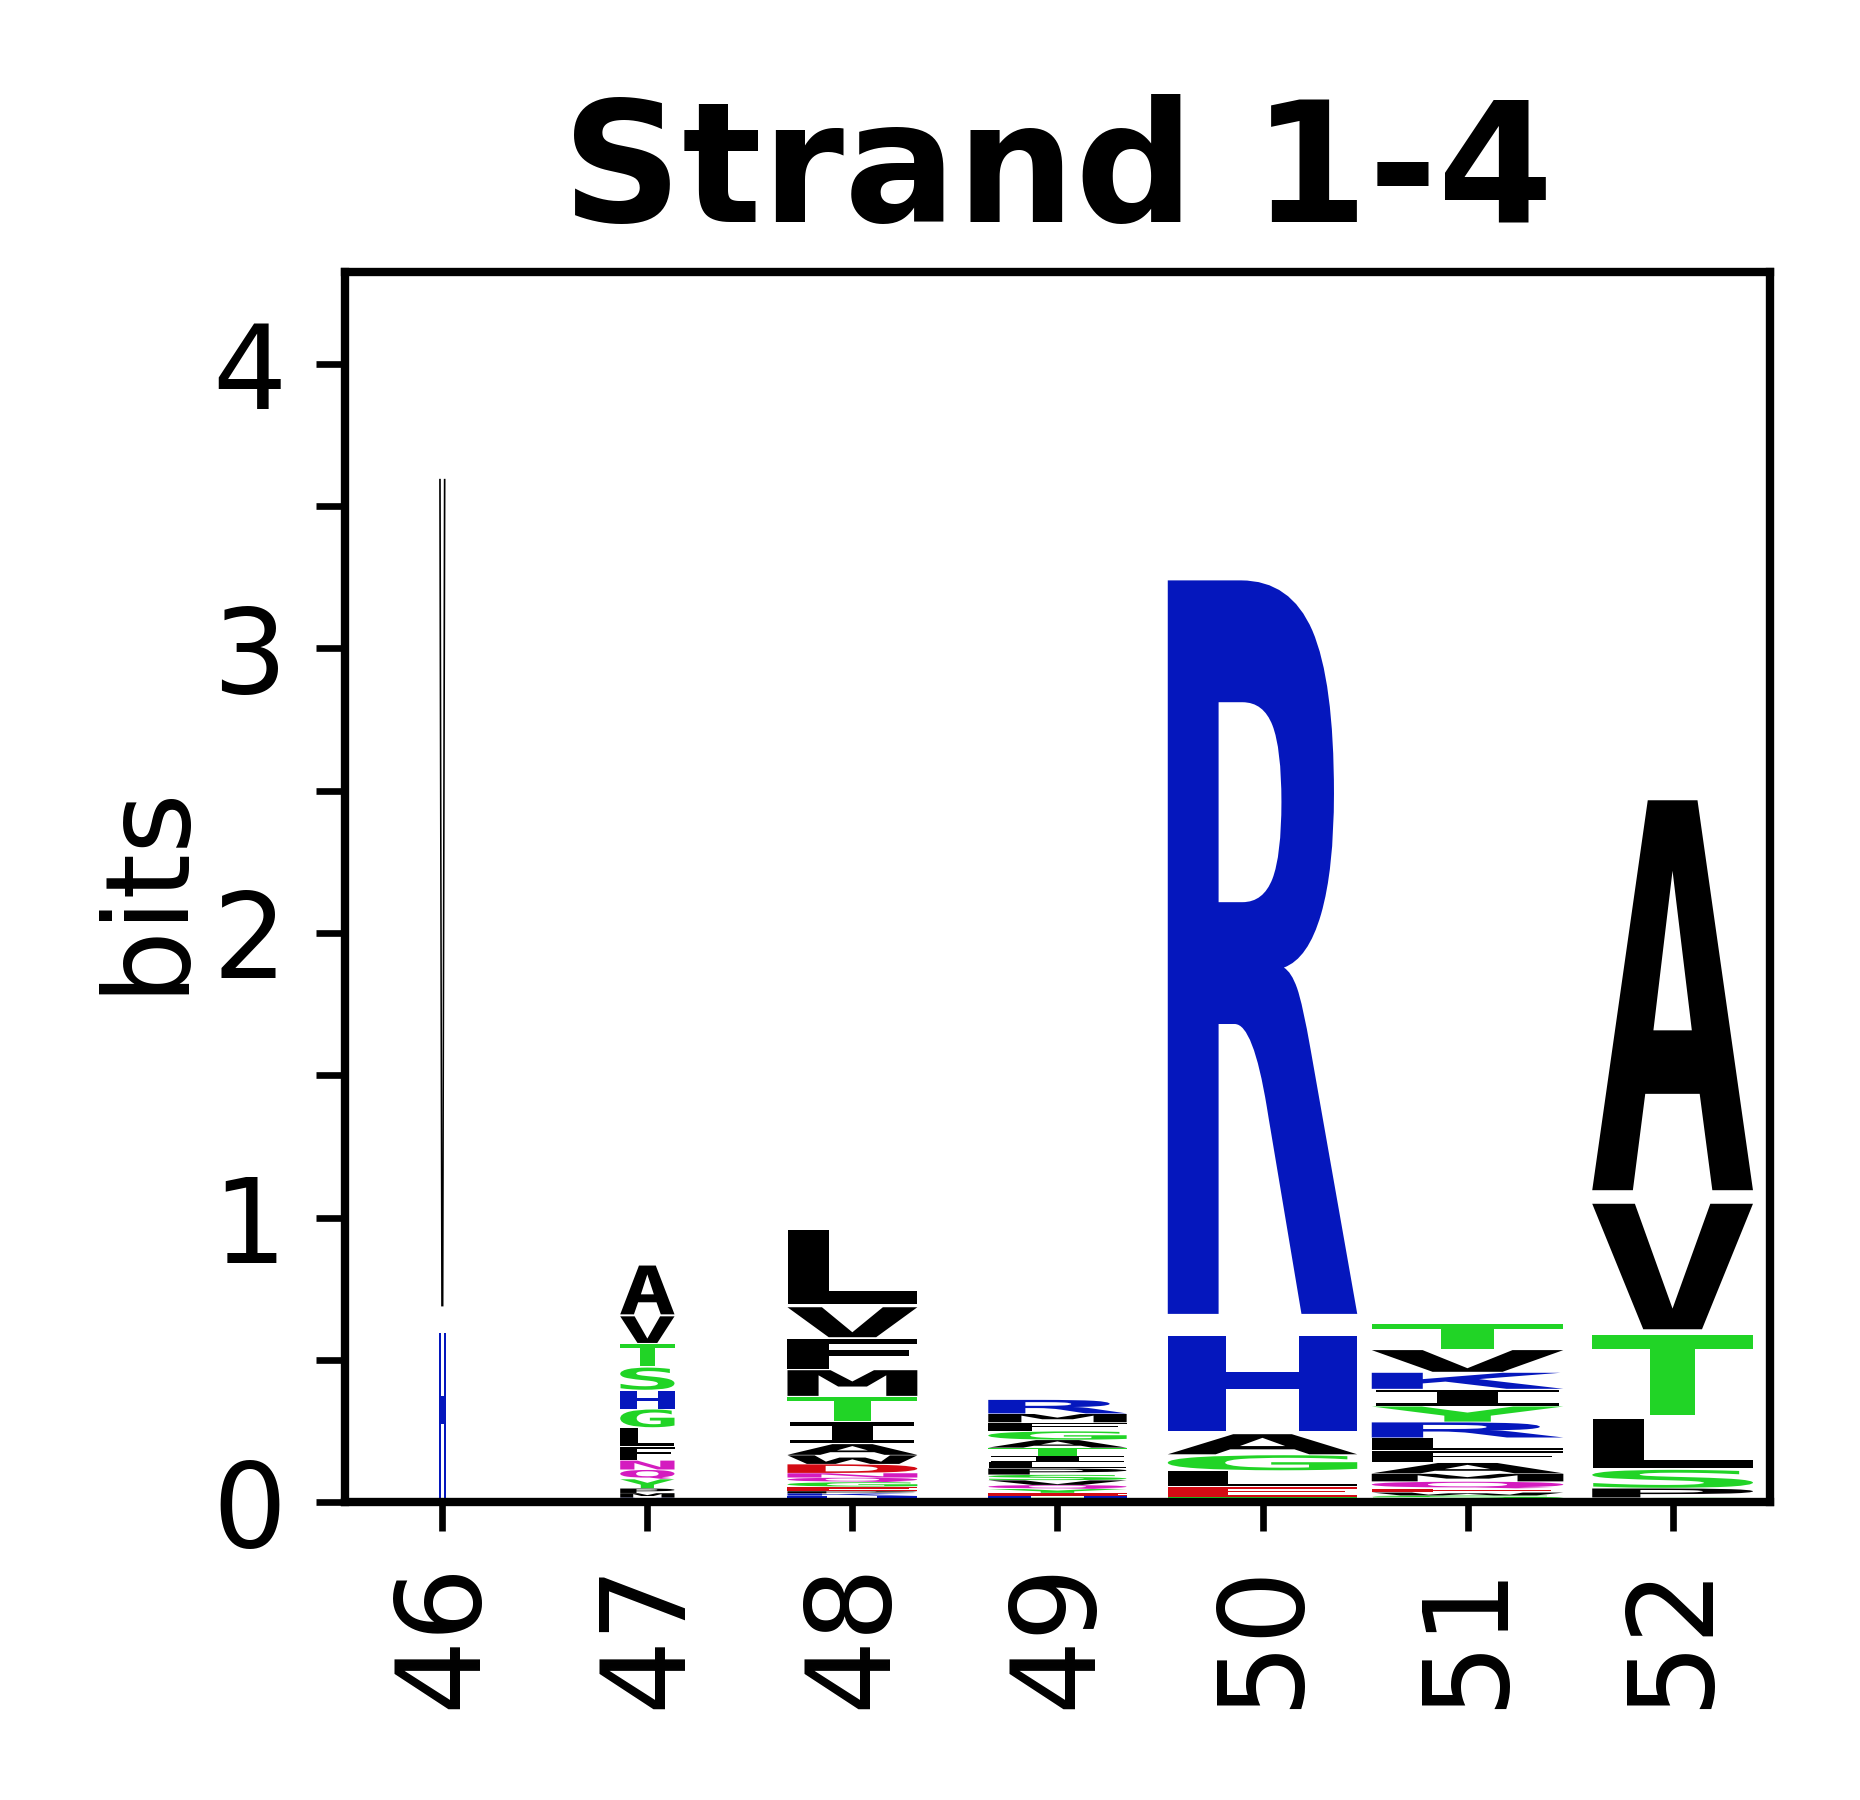
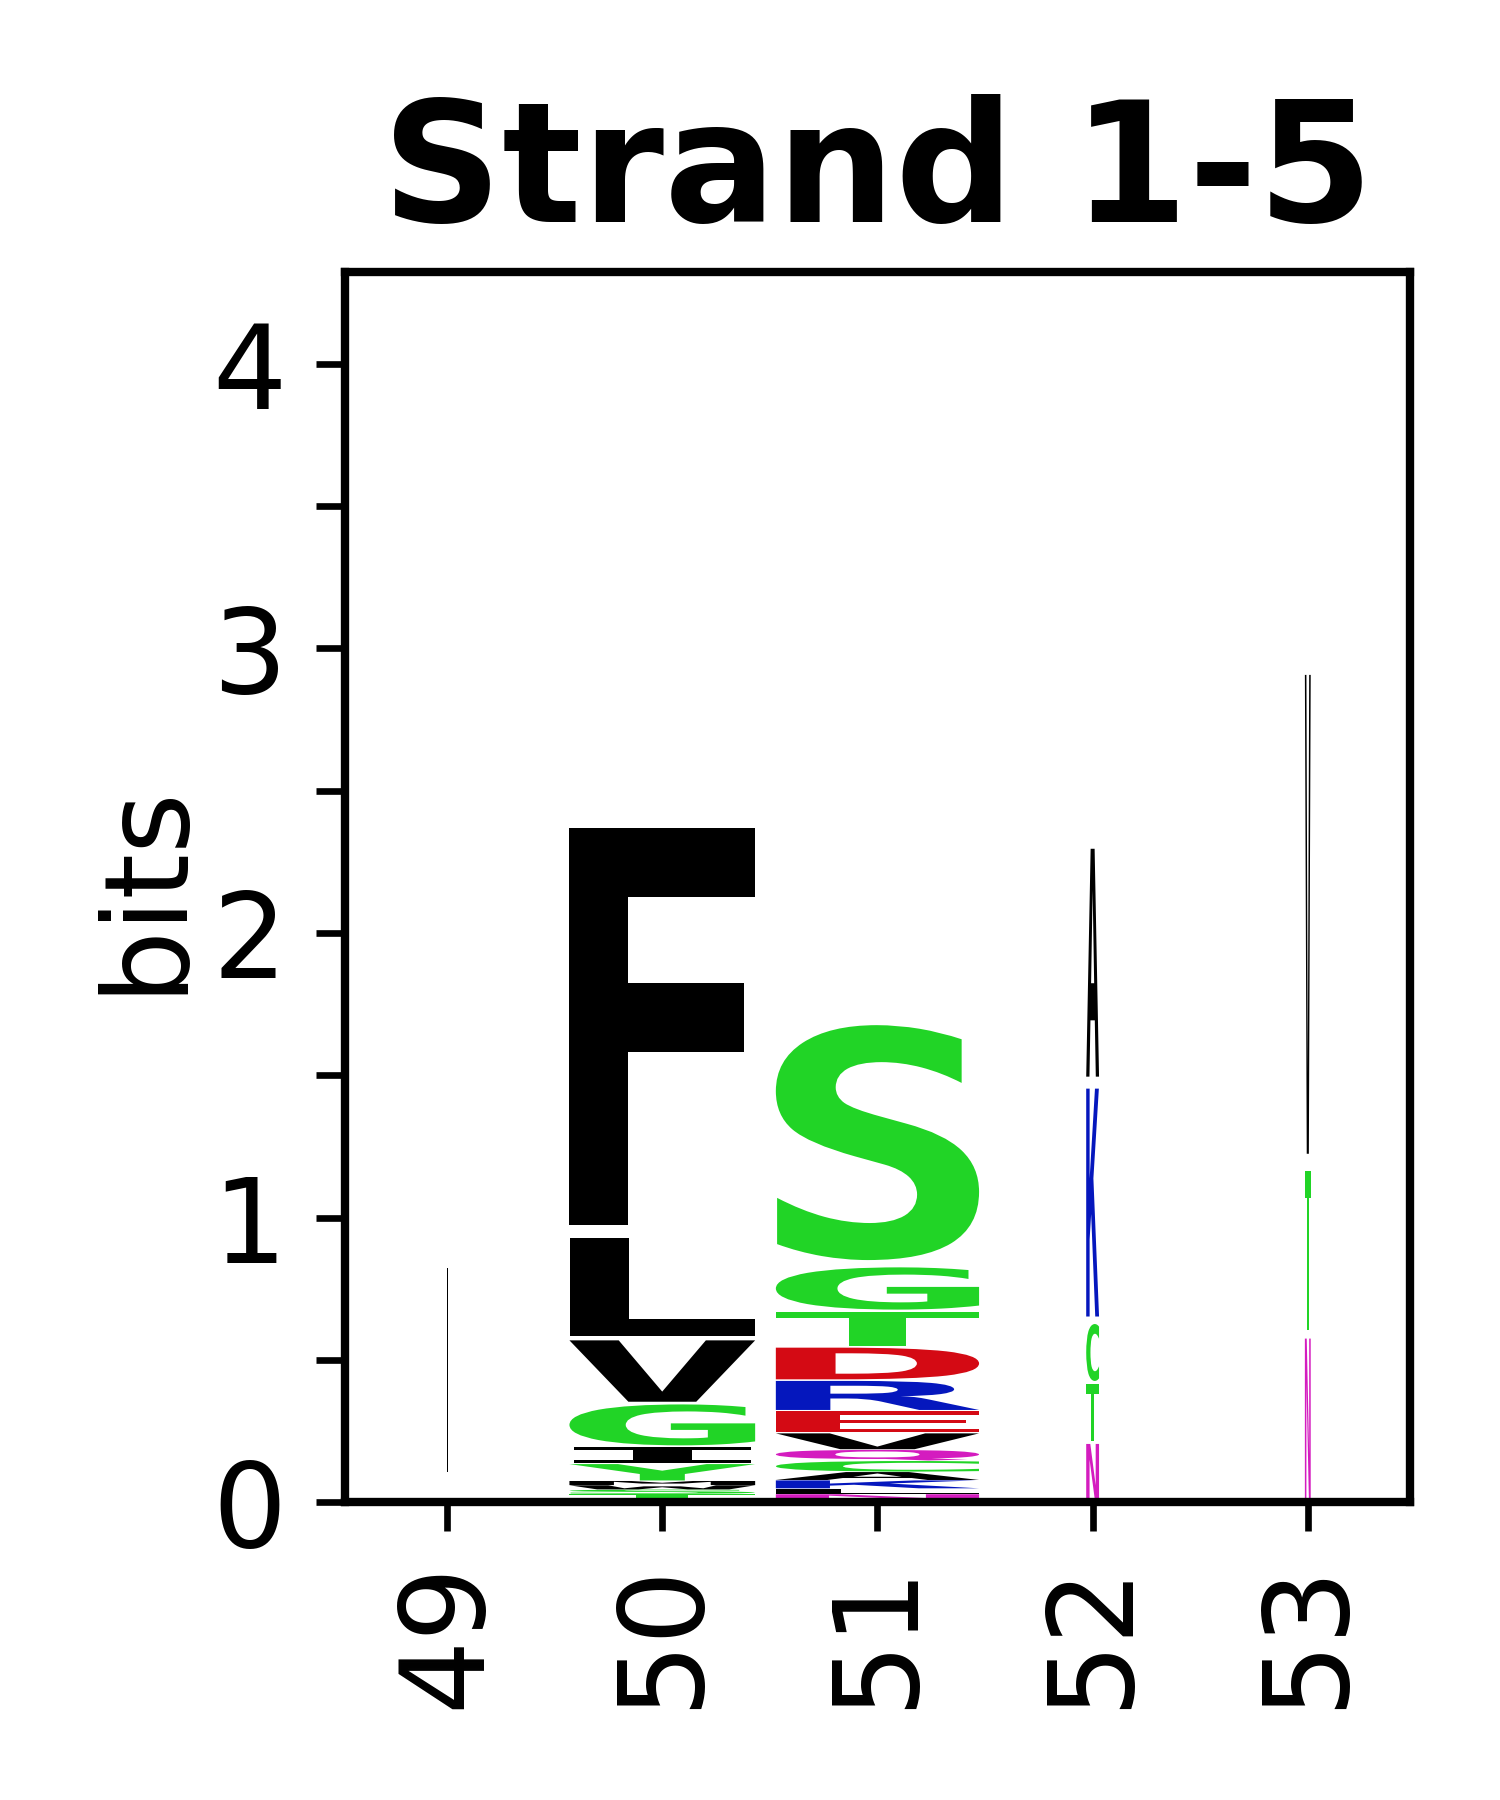
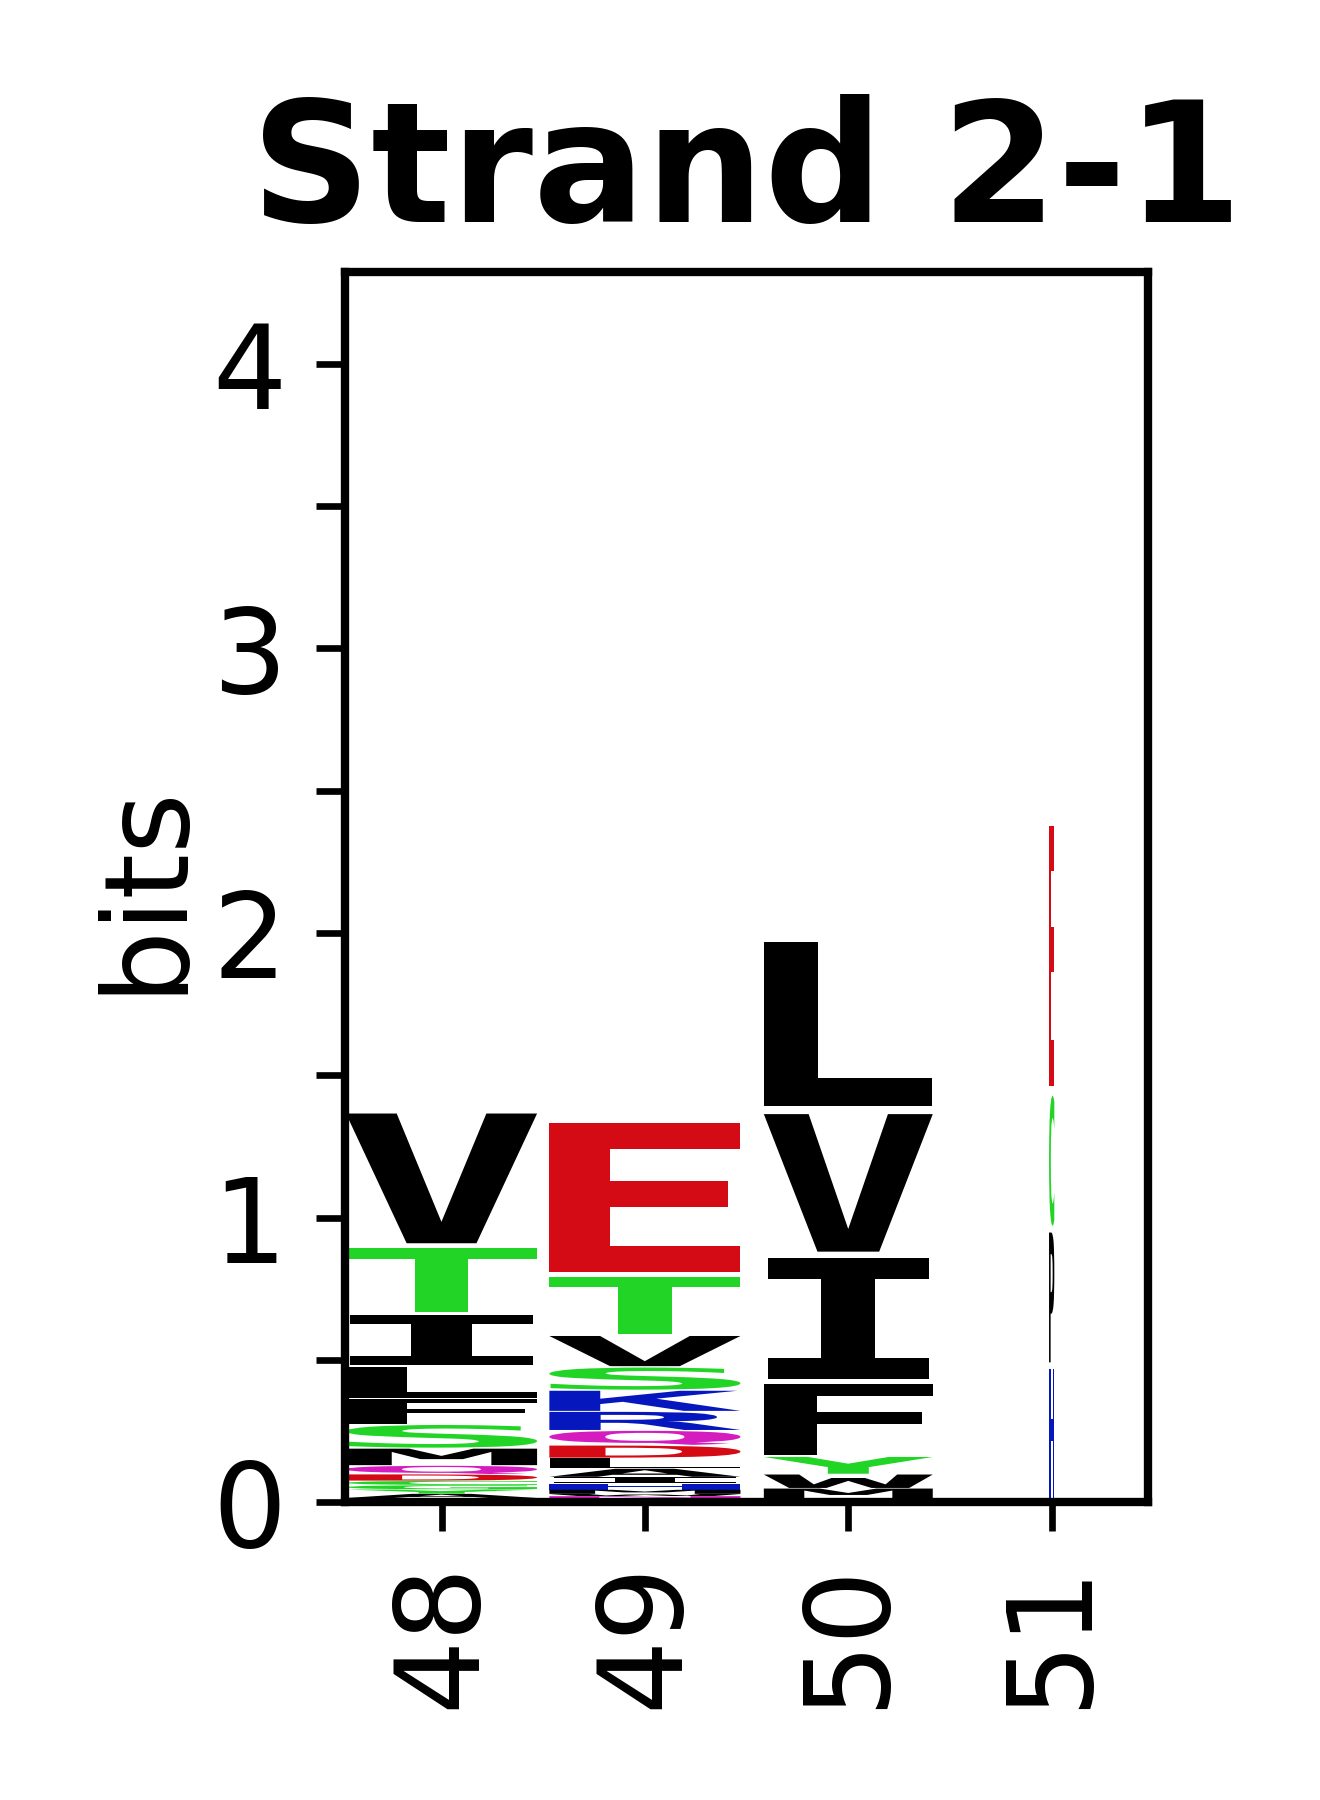
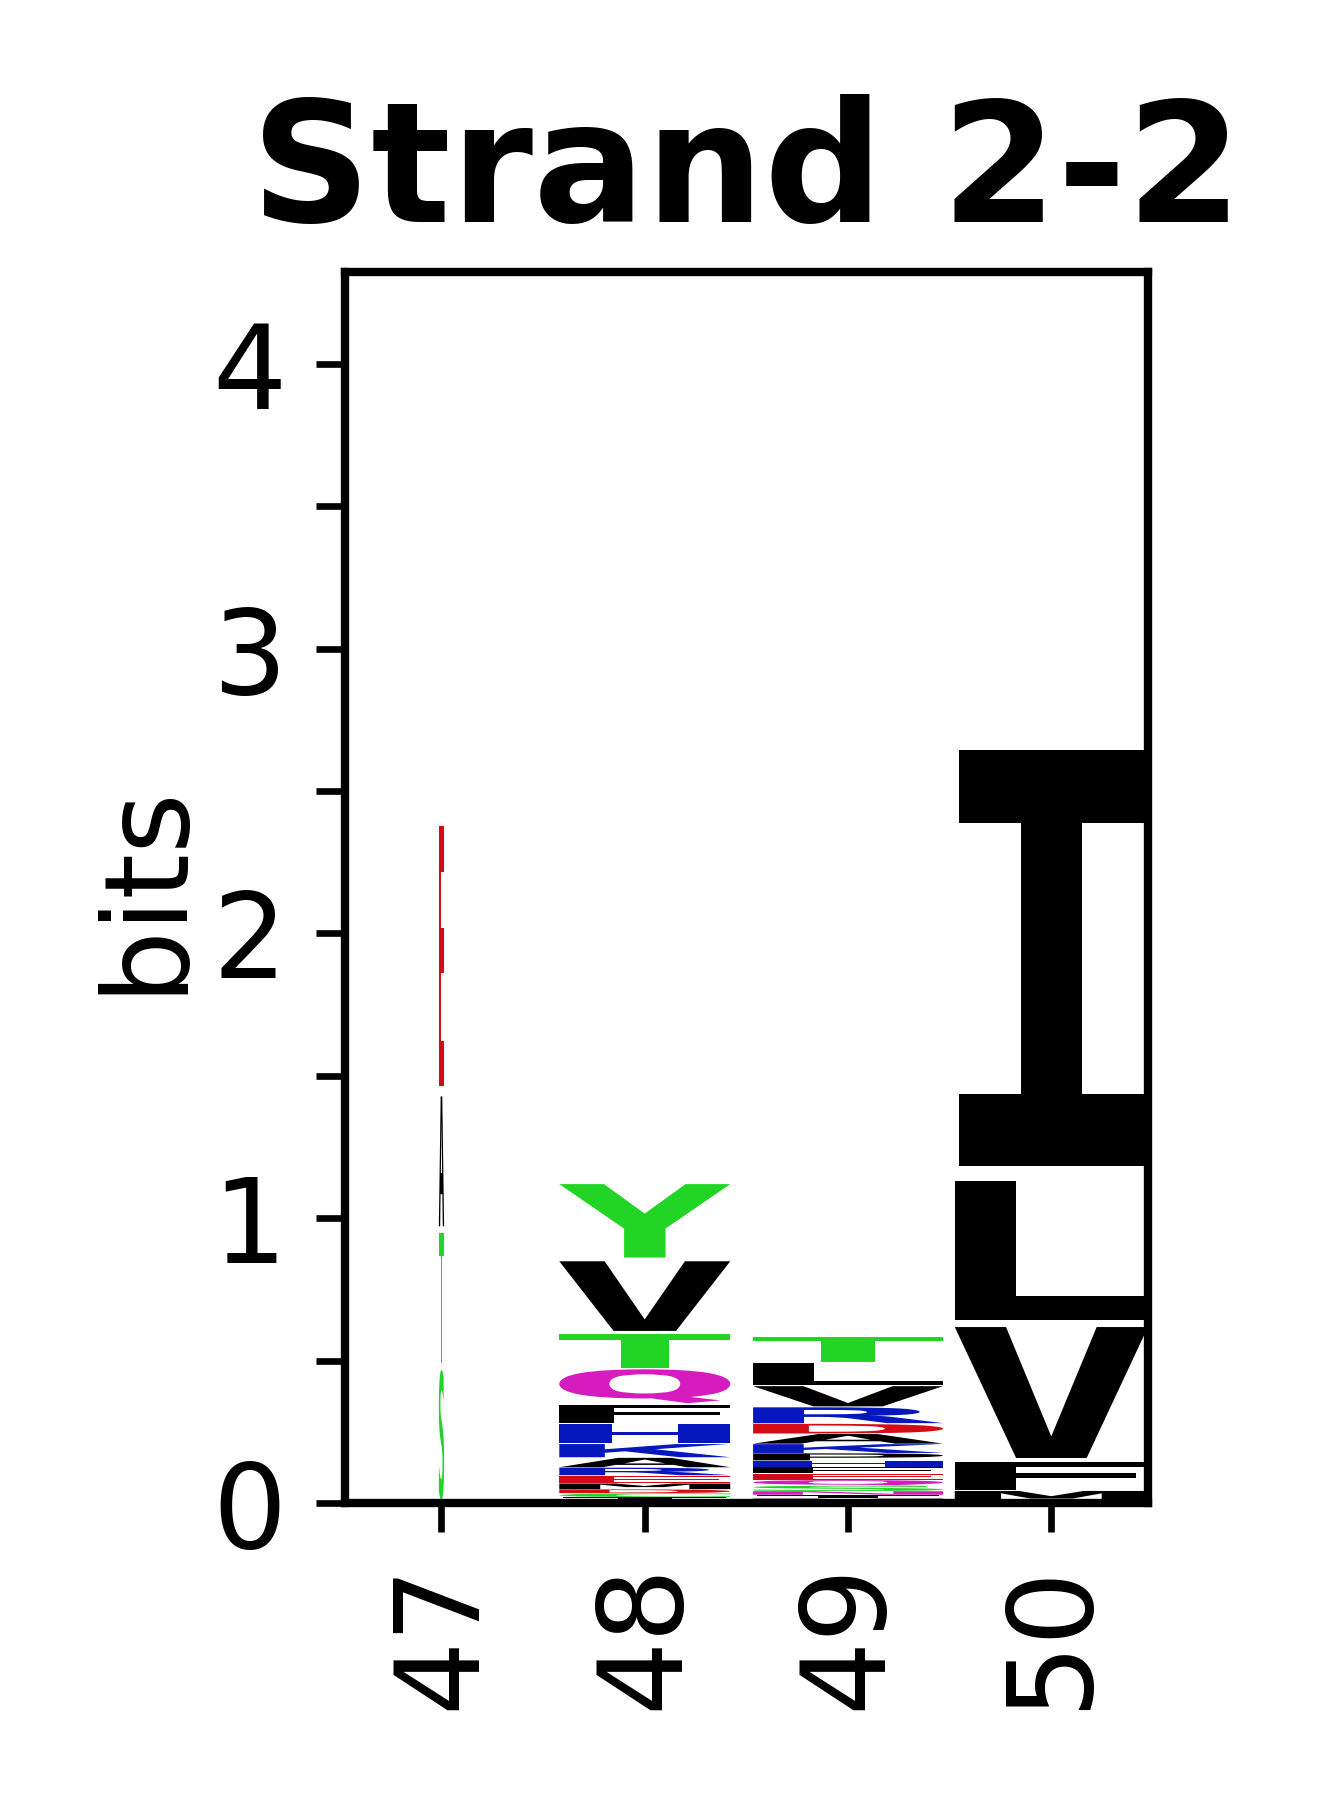
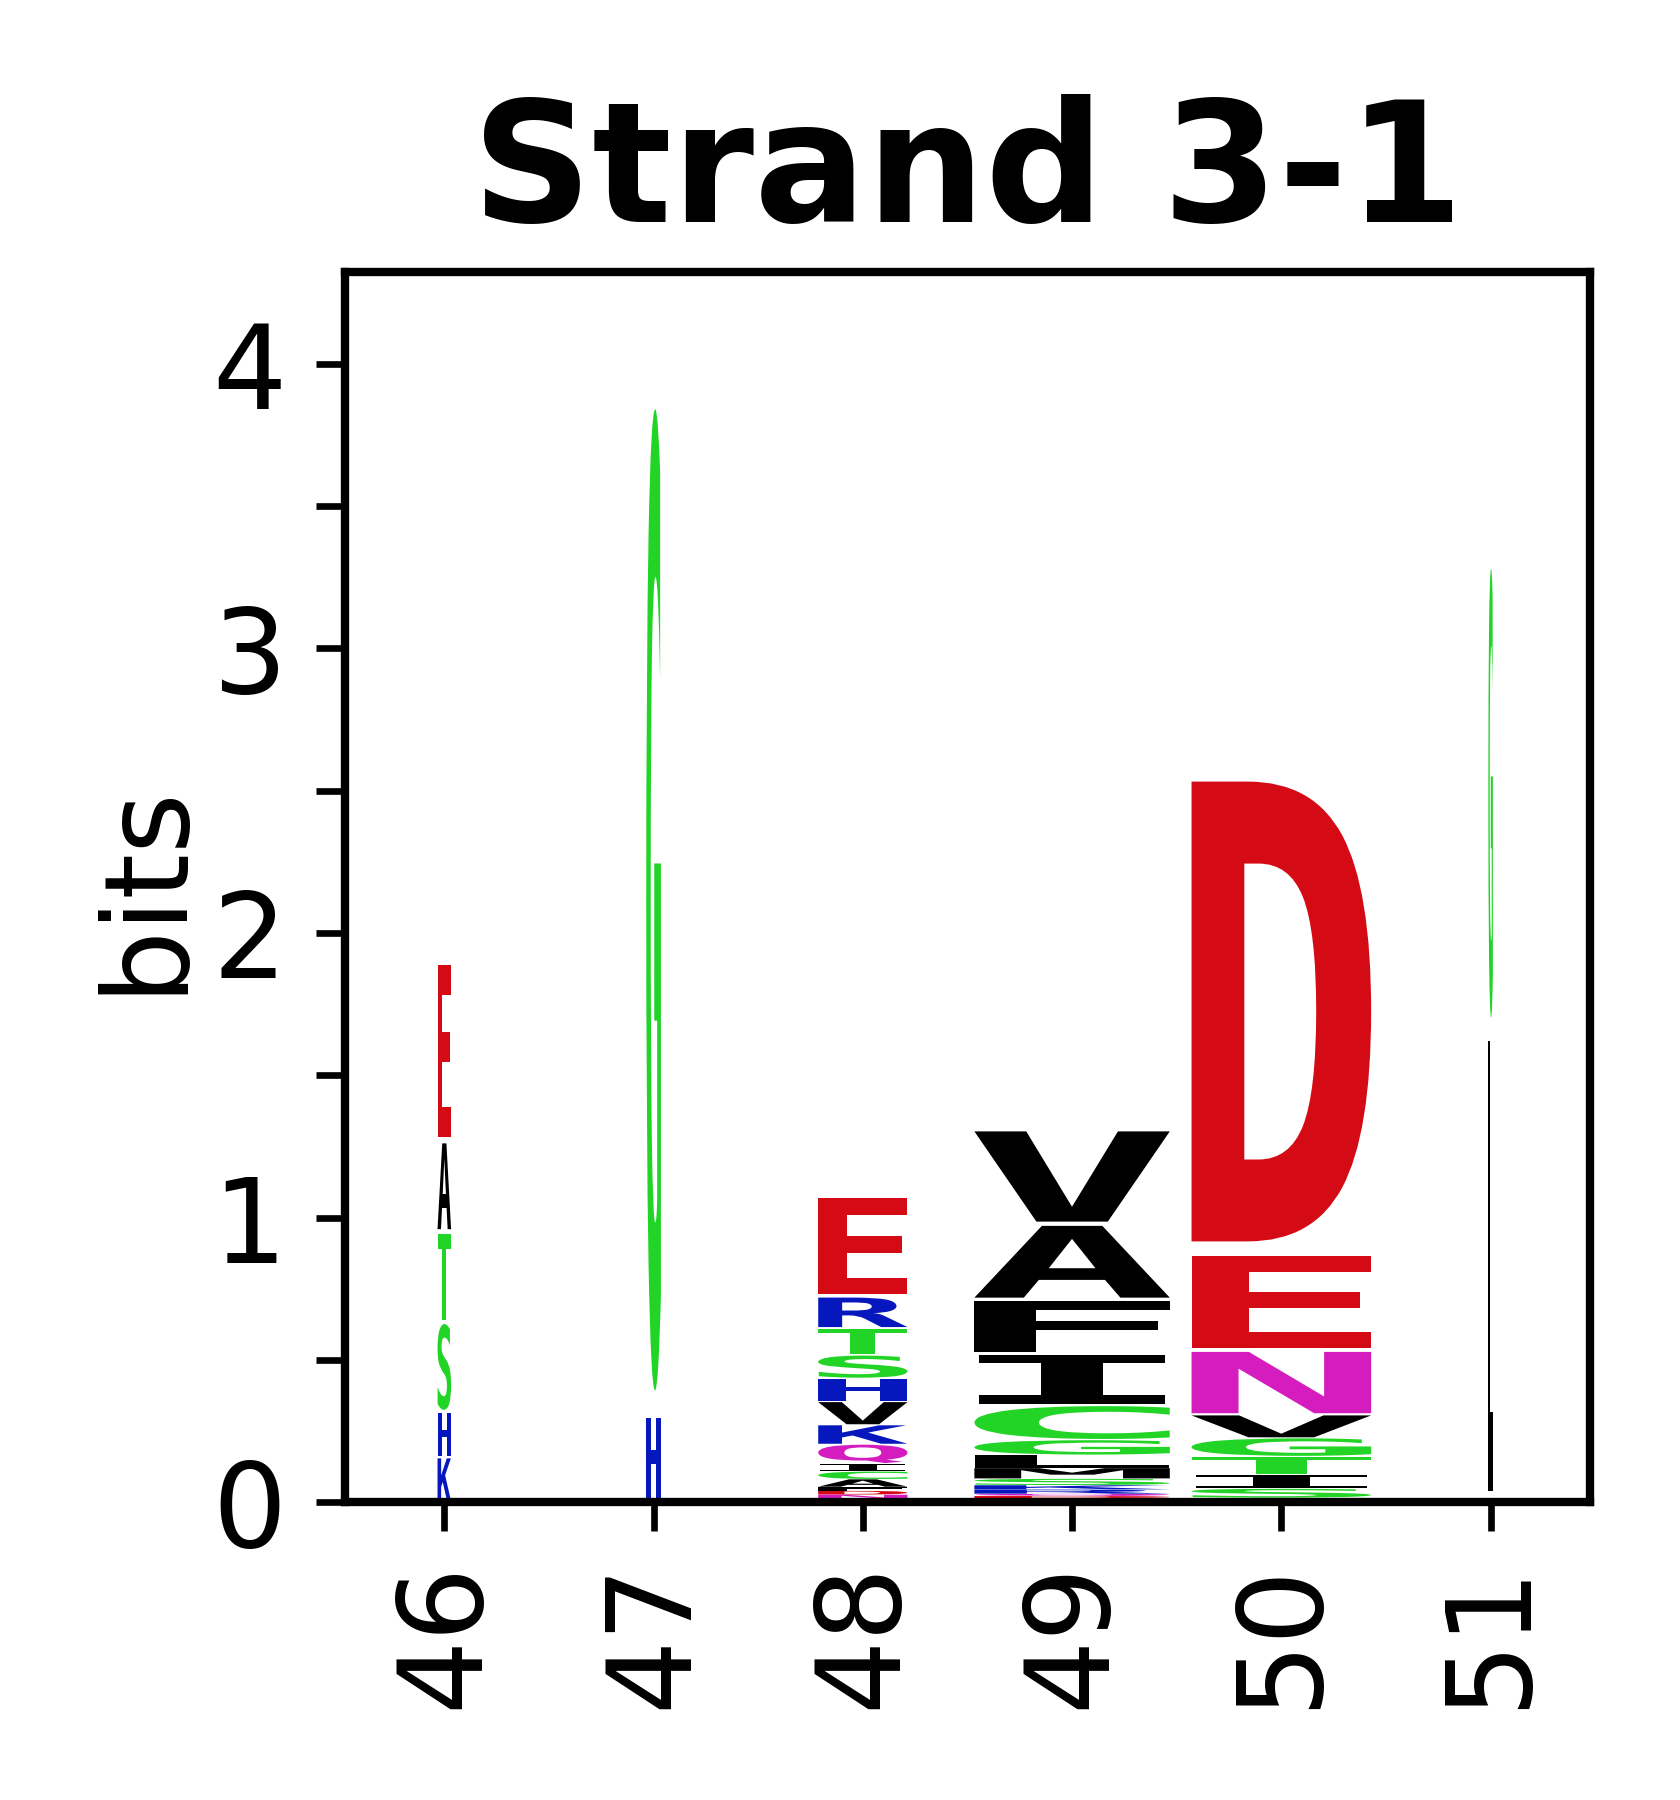
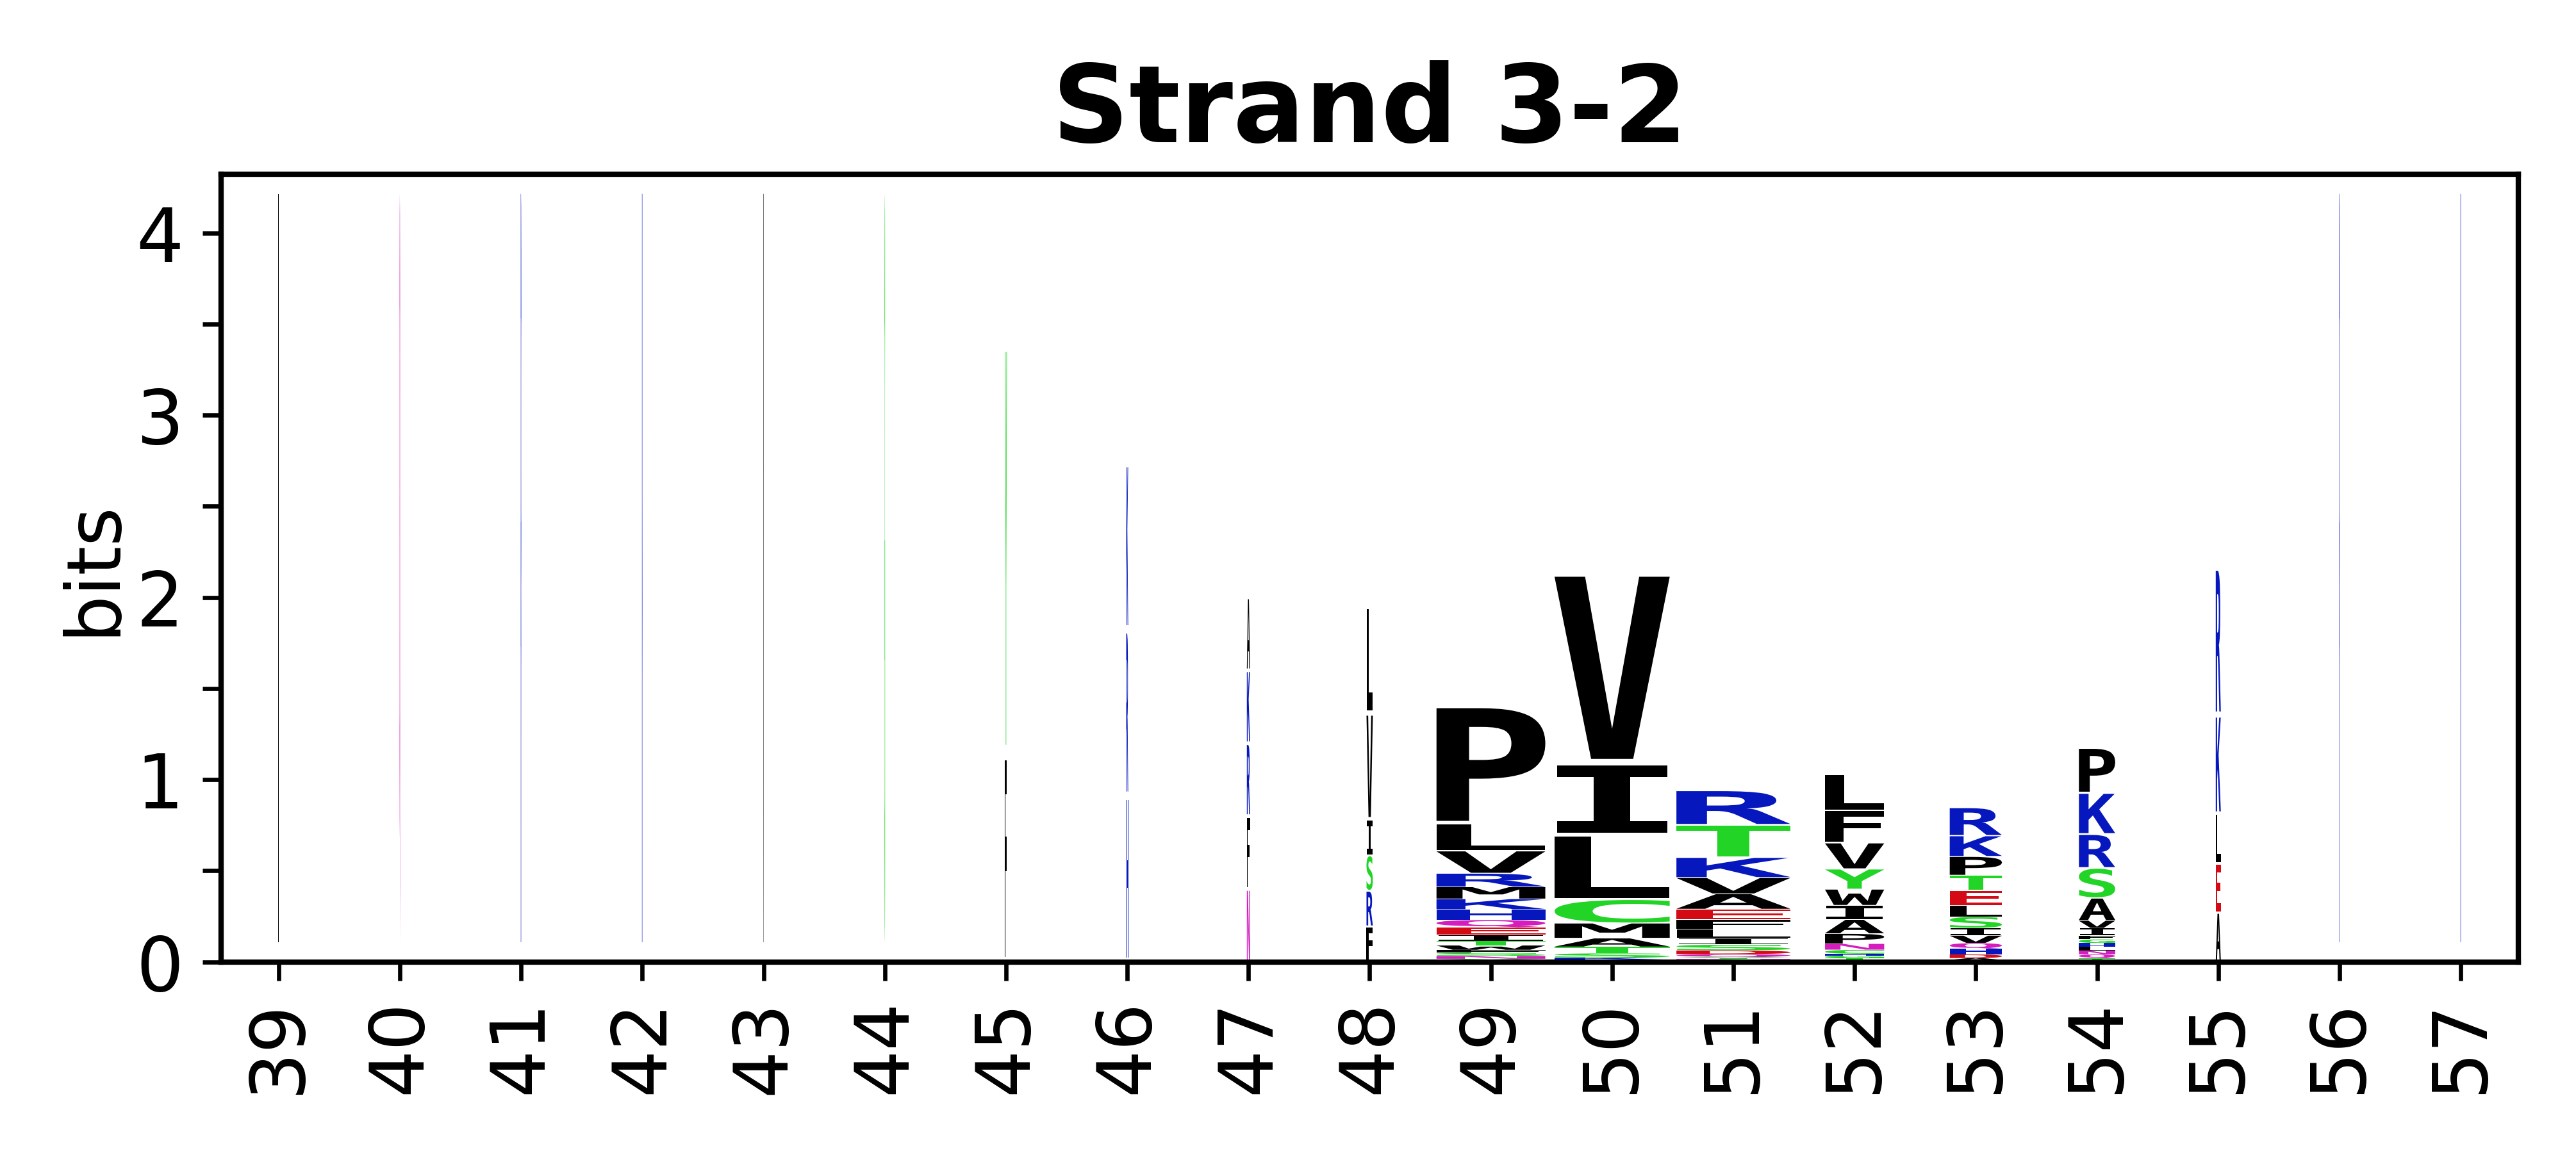
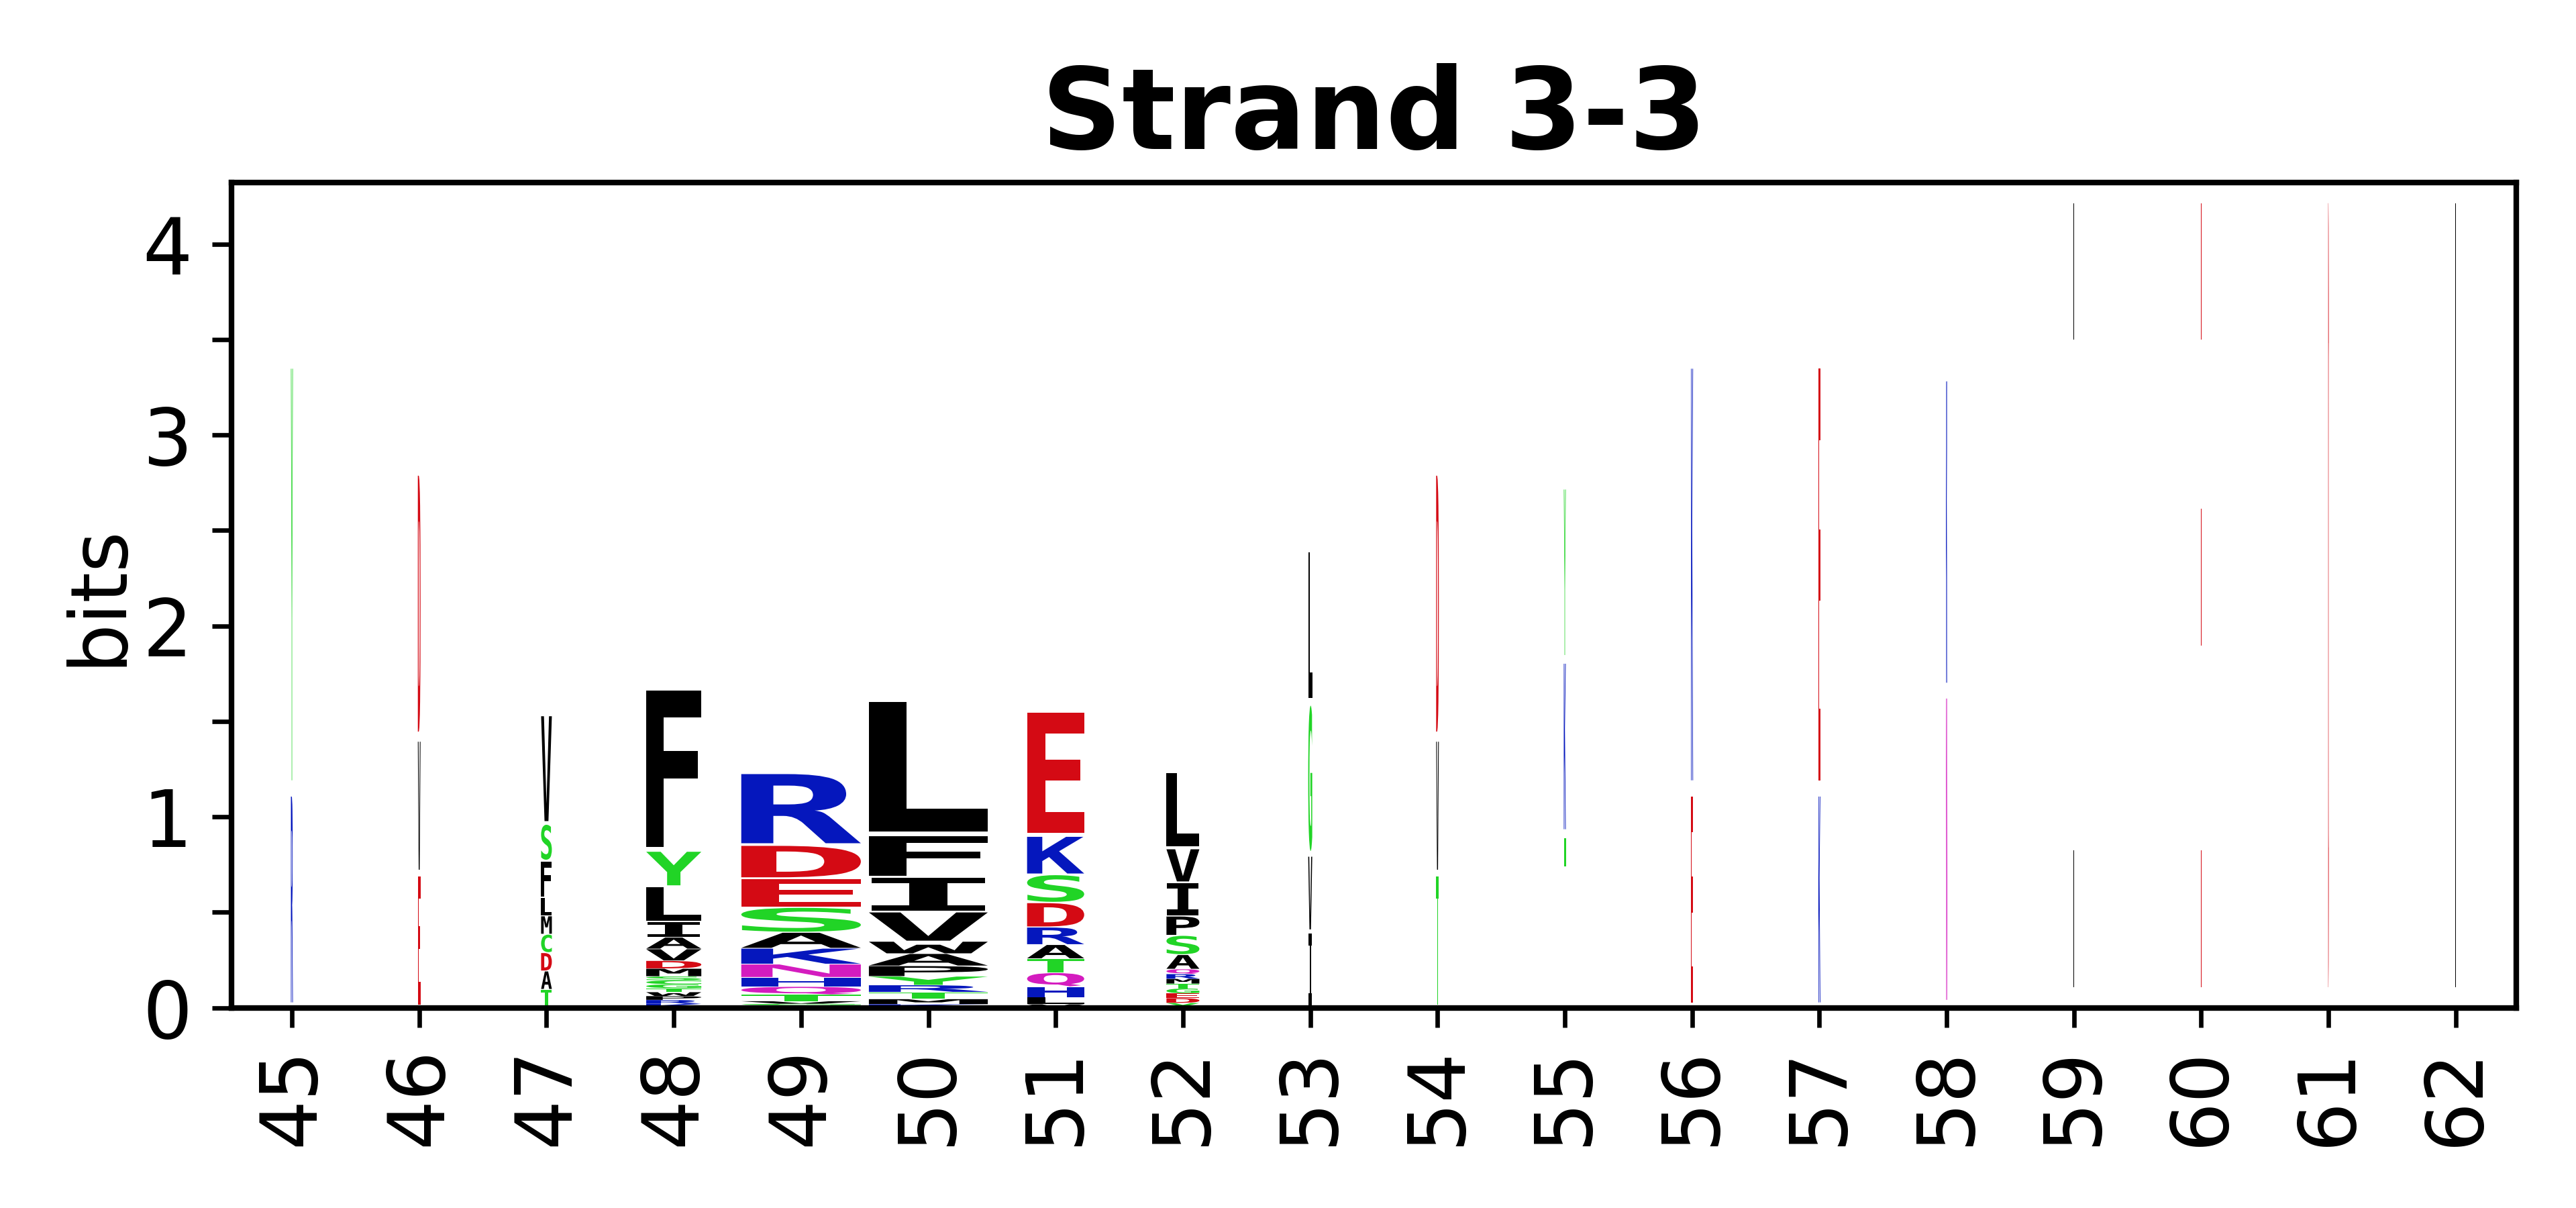
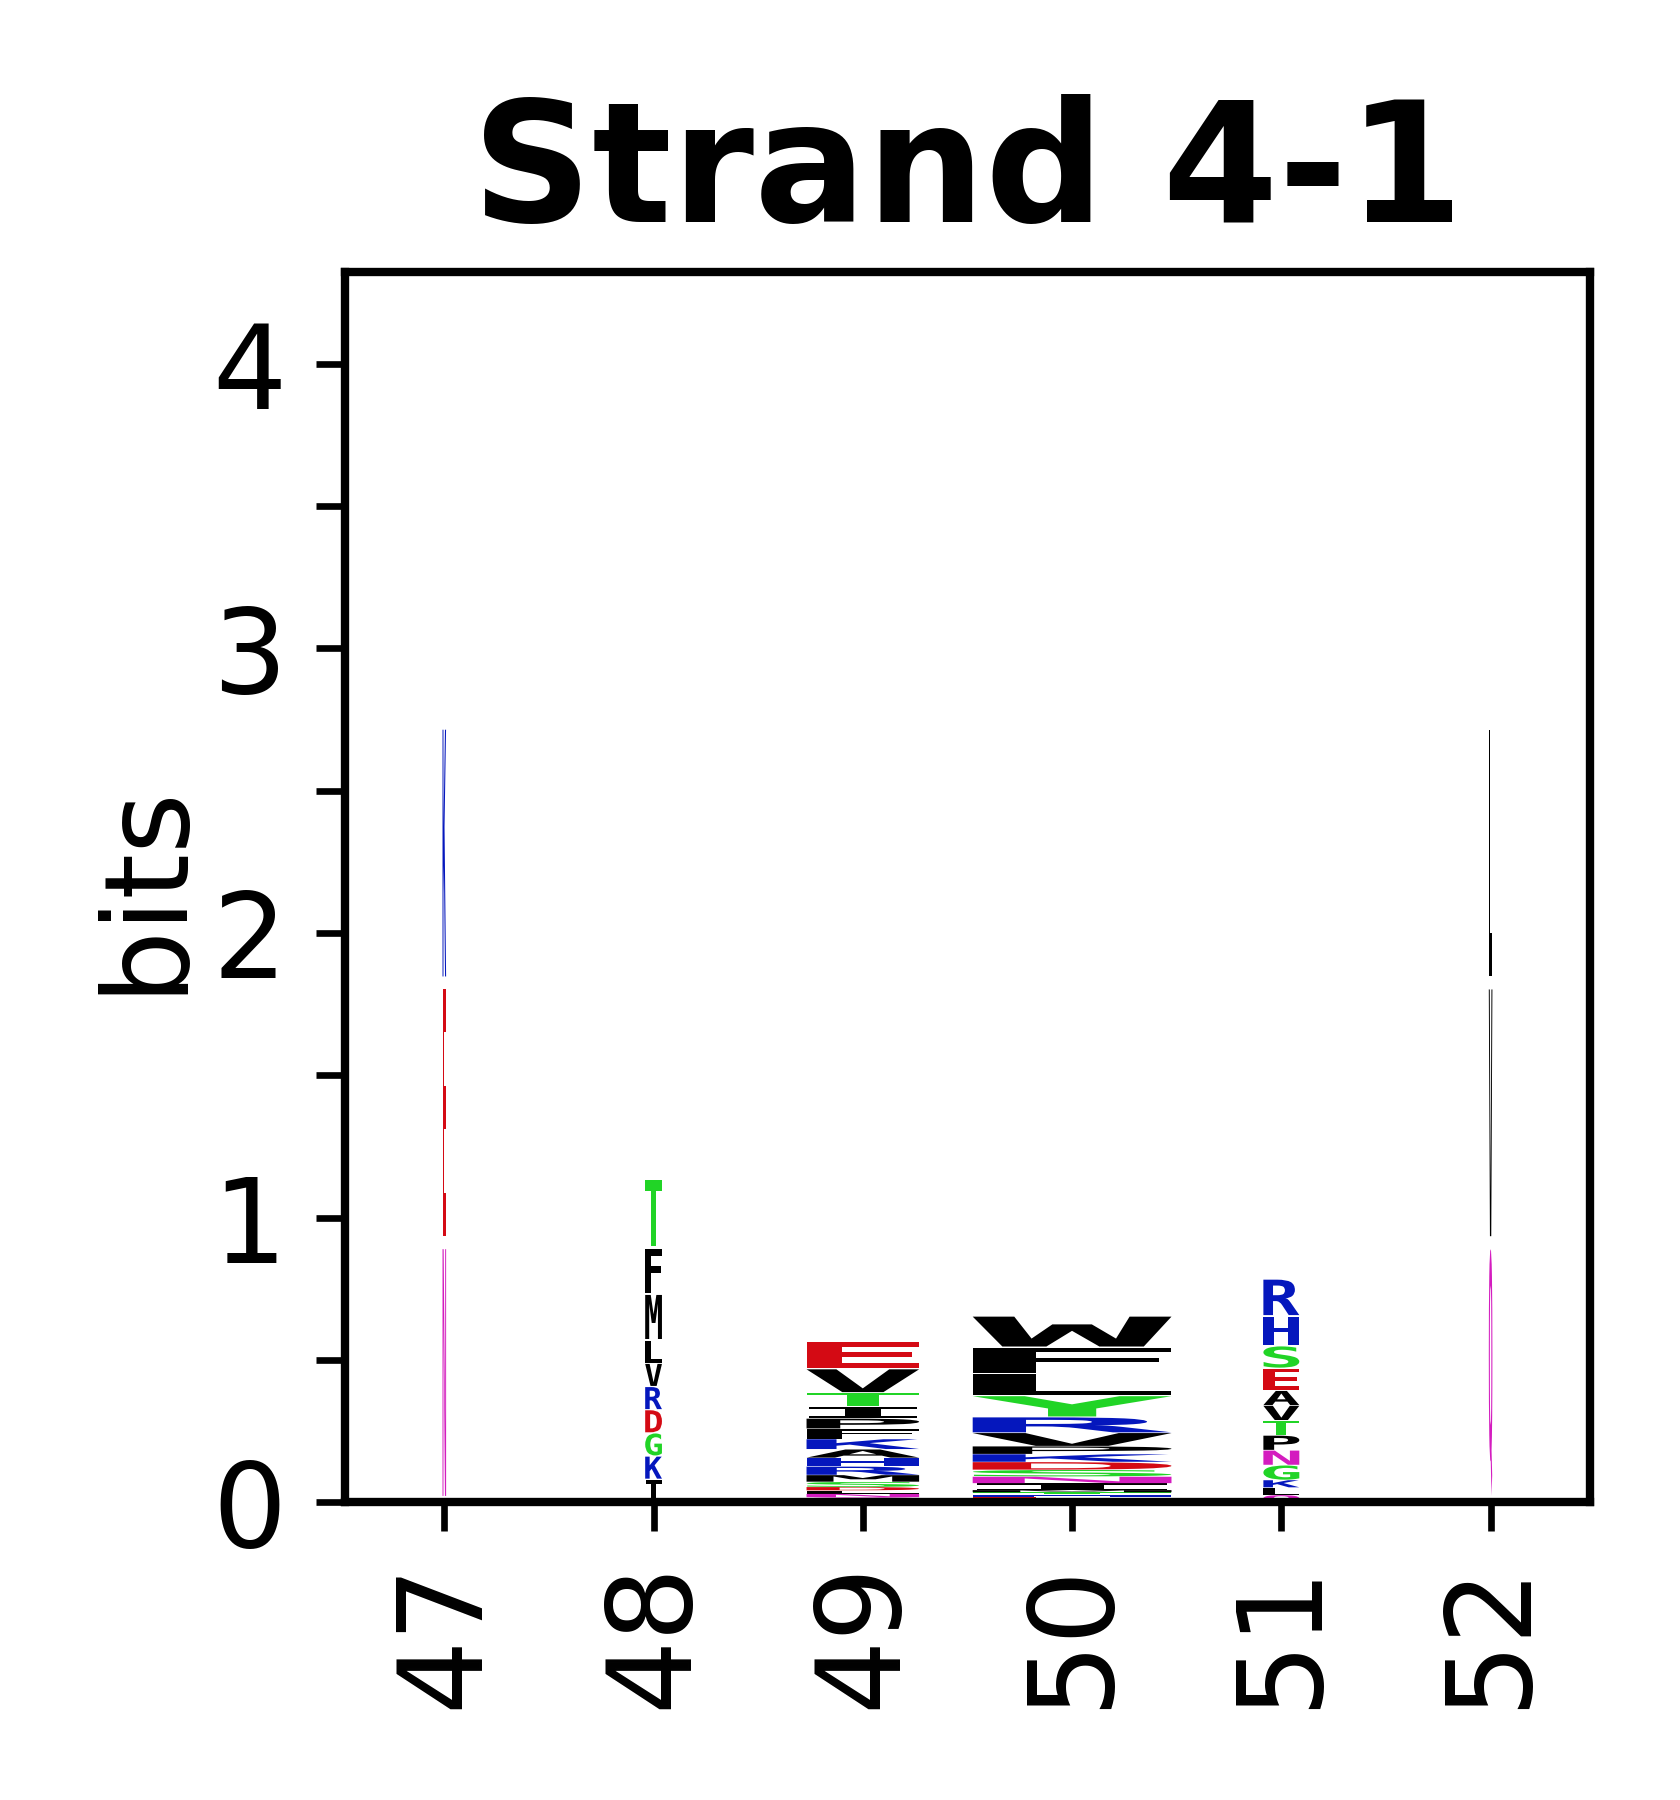
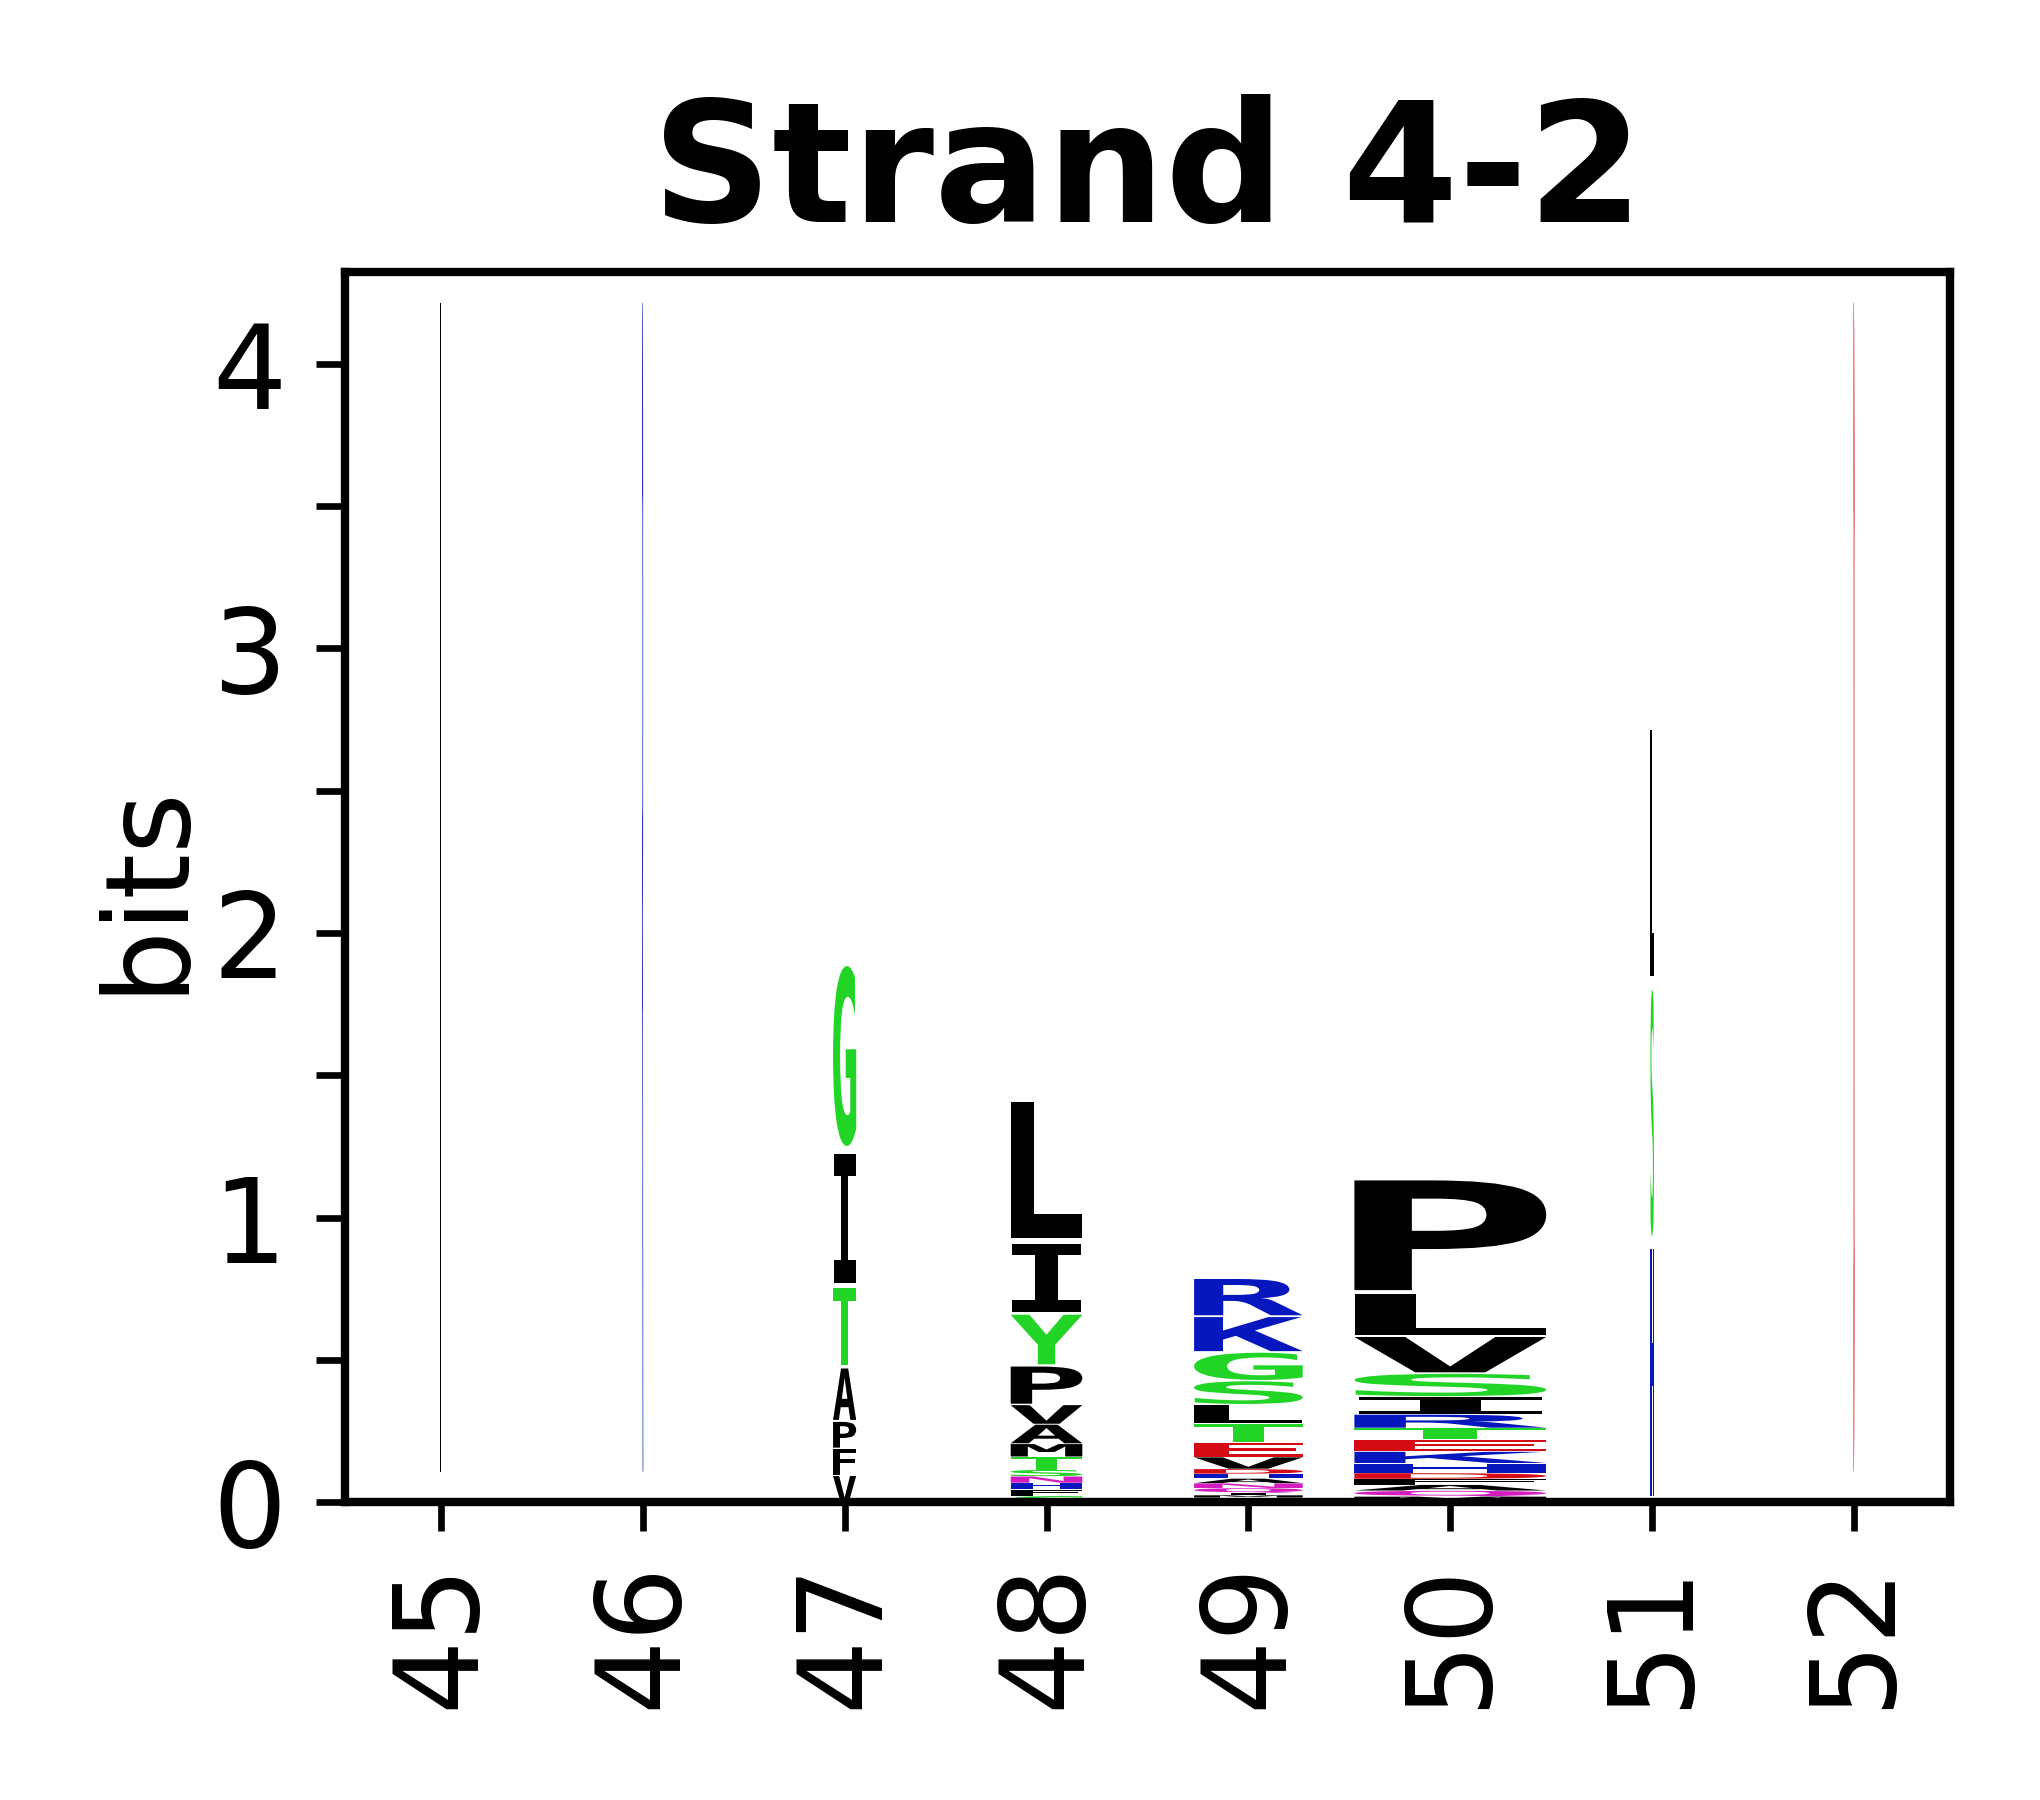
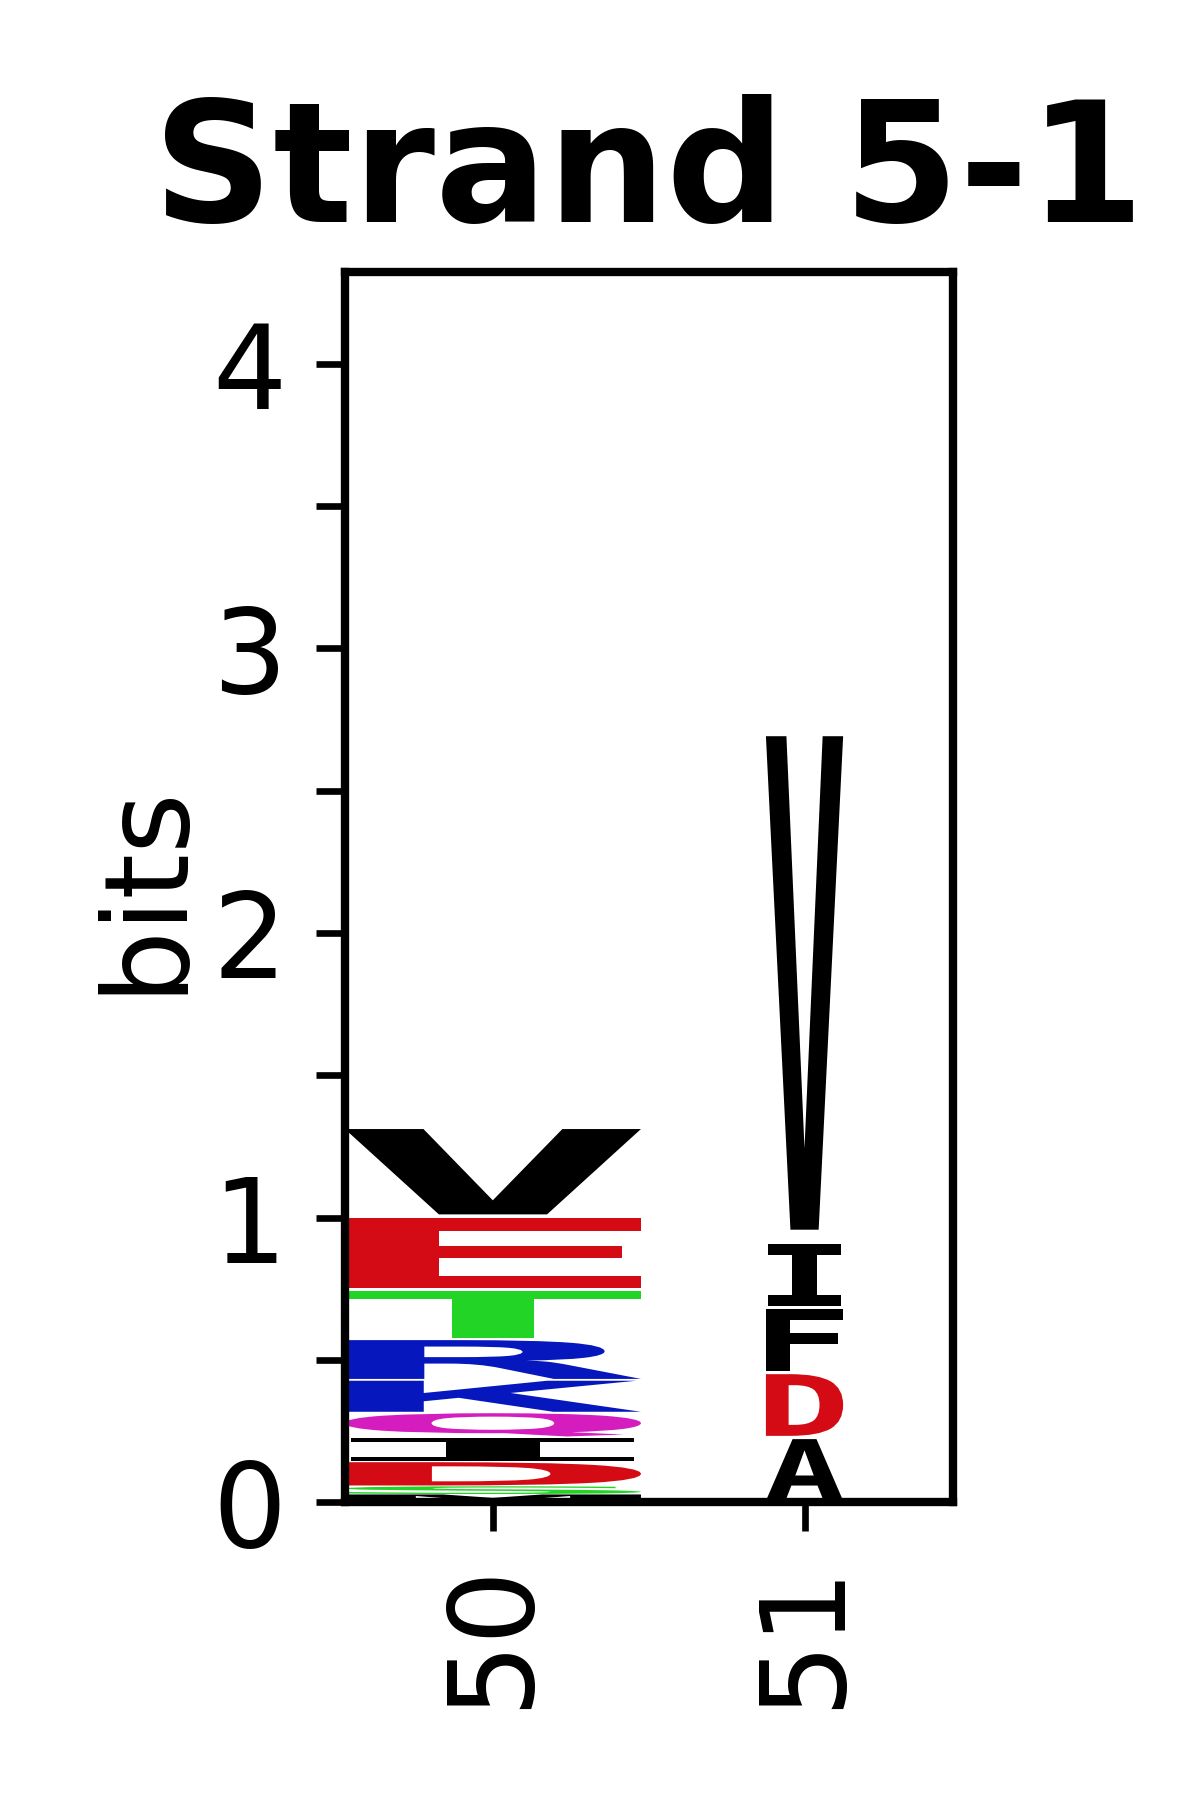
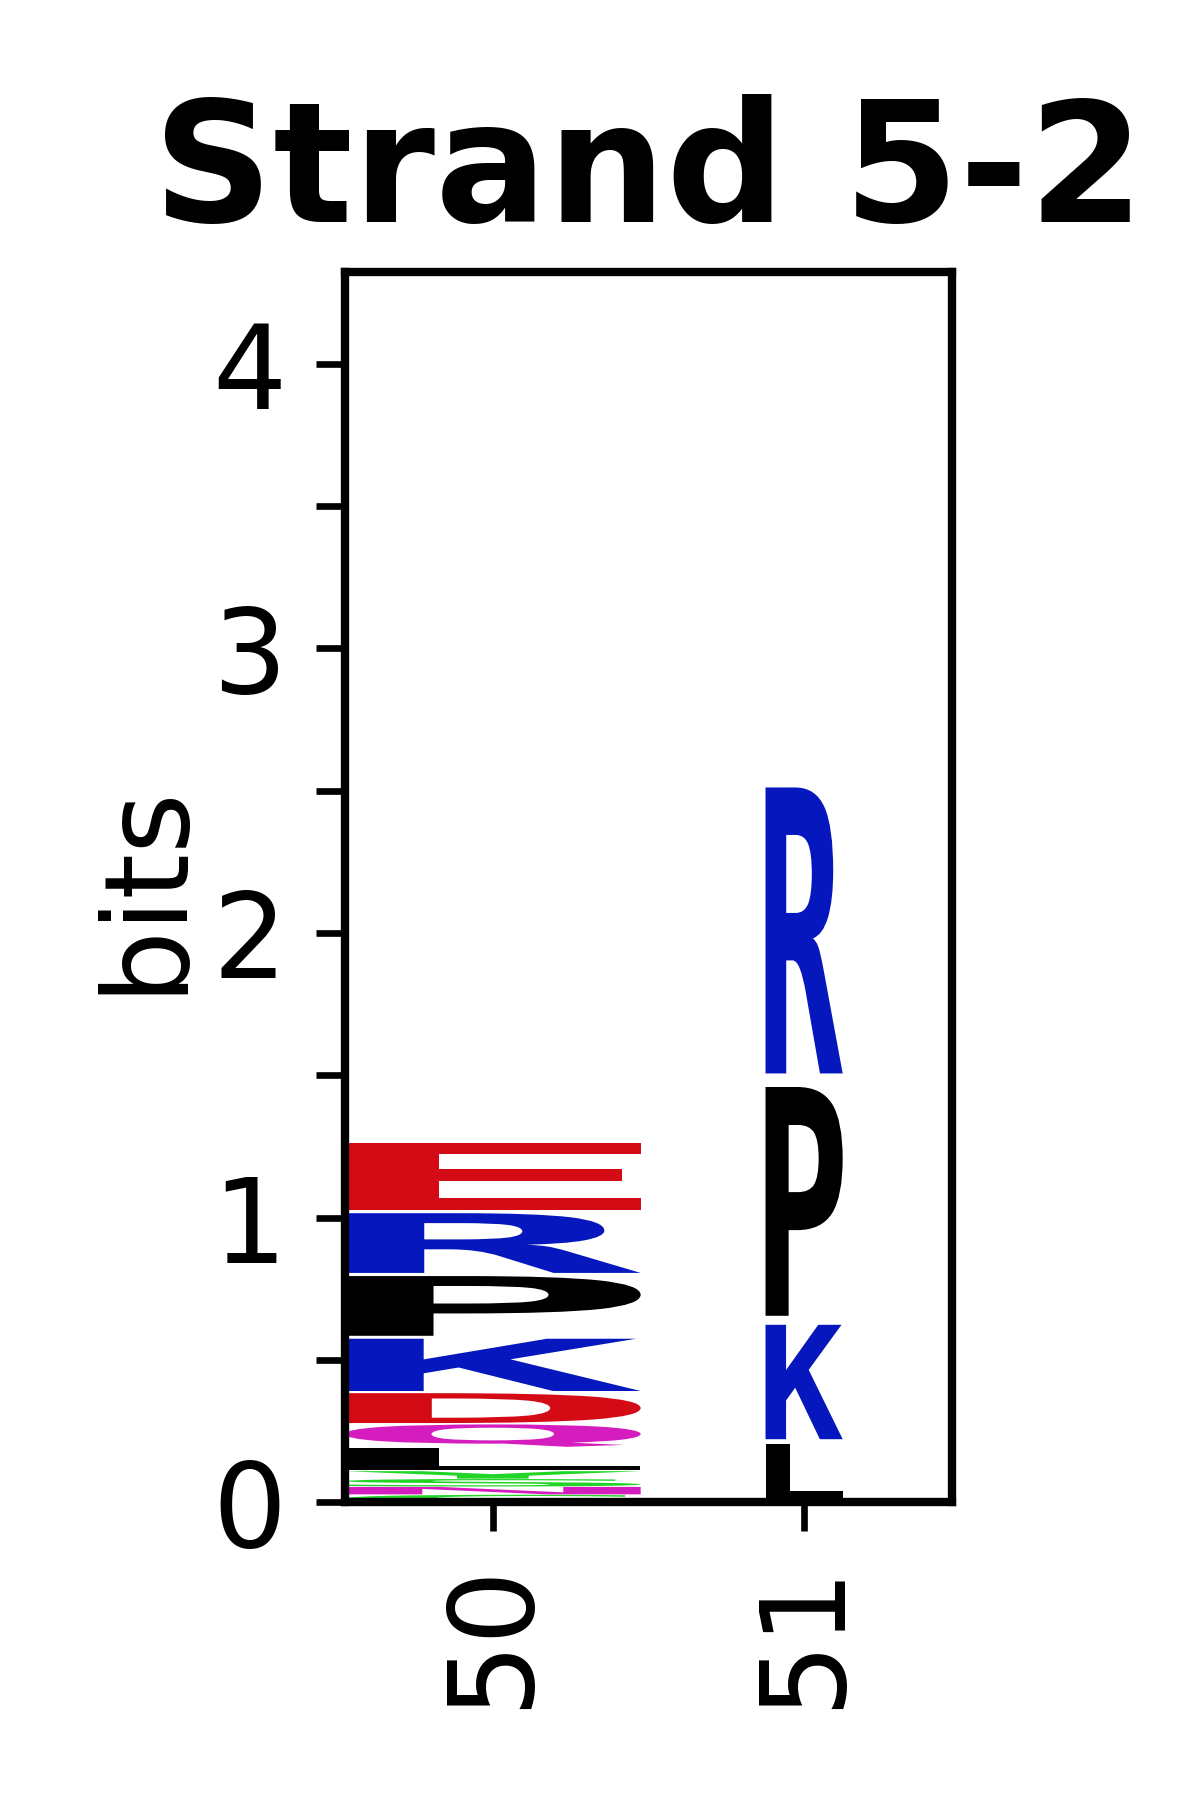
Sequence of SSEs
The amino acid sequences for each SSE can be aligned and used to produce a sequence logo. Where the sequence conservation is sufficient, we can establish a generic numbering scheme: the most conserved residue in helix X serves as its reference residue and is numbered as @X.50. The remaining residues in the helix are numbered accordingly.
- Helices
-
-
-
-
-
-
-
-
-
-
-
-
-
-
-
-
-
-

-
-
-
- Beta strands
-
-
-
-
-
-
-
-
-
-
-
-
-
-
-
-
-