NEEMP:Reports
Appearance
Along with NEEMP we provide an handy python script to generate charge correlation graphs and quality assay reports, named nut-report.py.
SCRIPT BASIC USAGE: ./nut-report.py chg-stats-out-file
Requirements:
- Python (https://www.python.org/)
NB: the script has been tested for both Python 2.7 and Python 3.4, as well as for R 3.2.
Figure 5 displays the required input file in which for each atom the difference between the reference QM charge and the EEM charge is calculated. Such a file can be obtained running NEEMP in quality validation mode with the option --chg-stats-out (see example or quality validation for details).

.
Once the script has been executed, a bunch of output files are generated in the chg-stats-out-file directory. In particular:
- csv files containing per-atom charge information and values for several performance evaluating metrics for each atomic type and molecule
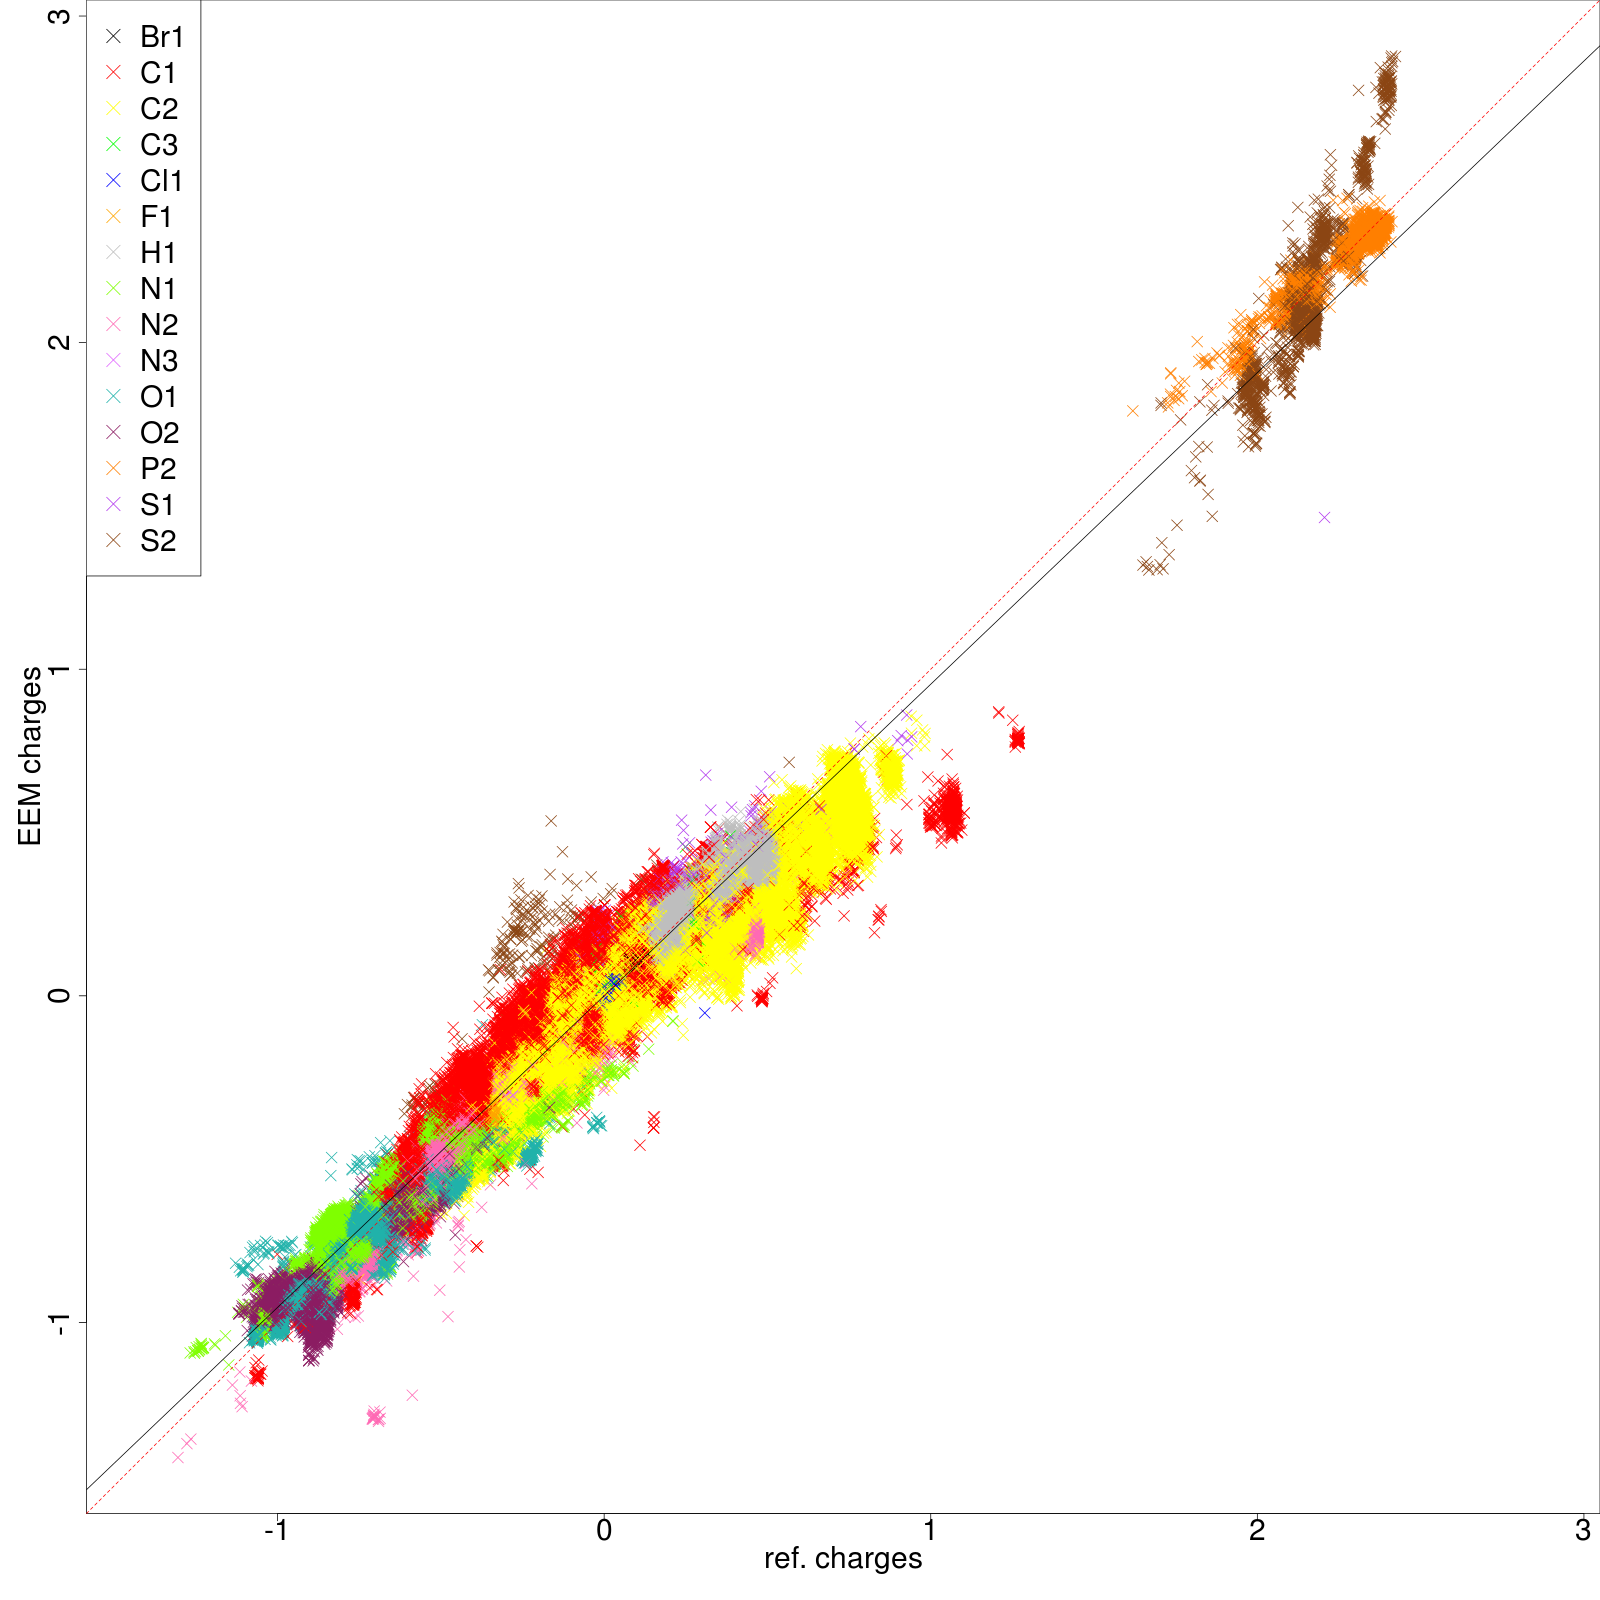
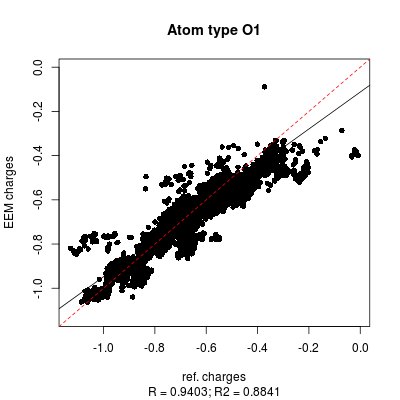
- png files displaying the charge correlation graphs for the whole set and for each atomic type (as shown in figure 6 and figure 7 respectively)
- html file gathering together all the previous information in an interactive and more easily readable report page (see figure 8 and figure 9 or click here for a more comprehensive view)

