NEEMP:Reports
Appearance
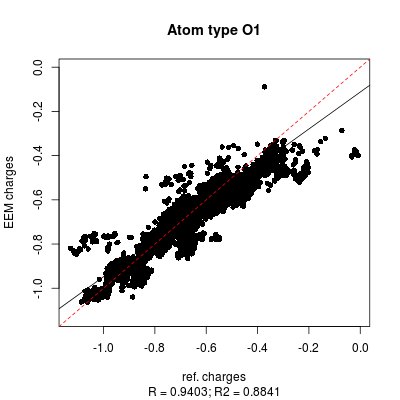
All the graphs in NEEMP's article showing the correlation between reference charges and EEM charges, have been generated employing two python scripts, nut-report.py and nut.plot.py. The required input file must contain the charge statistics as shown in figure and can be obtained running NEEMP in calculation or quality validation mode with the option --chg-stats-out (see here for details).

.
To generate the graphs the scripts must be called in the simple following way:
First:
- ./nut-report.py charge-stat-file
Then:
- ./nut-plot.py set01-data.csv colorful 5
- ./nut-plot.py set01-data.csv blackwhite 5
- ./nut-plot.py set01-data.csv colorfulbig 5
- ./nut-plot.py set01-data.csv colorful-zoomed 5
- ./nut-plot.py set01-data.csv blackwhite-zoomed 5
- ./nut-plot.py set01-data.csv colorfulbig-zoomed 5
Figure and demonstrate as the correlation graphs include both all atom and individual atomic types dependency.
| File:Set3 DE RMSD B3LYP 6311G NPA cross ideal all-summary.pgn | 
|
| Figure 2: Detailed view of the LR parametrization settings for two distinct NEEMP executions differing in the best-performance selection metrics (R2 in left side image and RMSD in the right side image). | |