ChargeCalculator:Interpretation of results: Difference between revisions
| Line 21: | Line 21: | ||
=Specifics page= | =Specifics page= | ||
The '''ACC Specifics page''' contains the results of all atomic charge calculation jobs pertaining to ''a single molecule'' | The '''ACC Specifics page''' contains the results of all atomic charge calculation jobs pertaining to ''a single molecule''. The molecule is identified according to the name of the original input file. The '''Specifics page''' is organized into functional tabs which allow to view and analyze various parts of the data directly in your browser. | ||
==Summary== | ==Summary== | ||
The '''Sumary''' tab contains an overview of the calculation, including warnings. Basic information about the input molecule and the setup of the calculation. | |||
The ''molecule'' comprises all structural elements present in the <b>input file</b>, regardless of annotations. Molecular formula, describing the atomic composition. Total charge of the molecule, distributed across the constituent atoms based on the Electronegativity Equalization Method (EEM). Total duration of all jobs for this molecule. Individual job timing available for download with the rest of the results. | The ''molecule'' comprises all structural elements present in the <b>input file</b>, regardless of annotations. Molecular formula, describing the atomic composition. Total charge of the molecule, distributed across the constituent atoms based on the Electronegativity Equalization Method (EEM). Total duration of all jobs for this molecule. Individual job timing available for download with the rest of the results. | ||
Revision as of 12:26, 4 December 2014
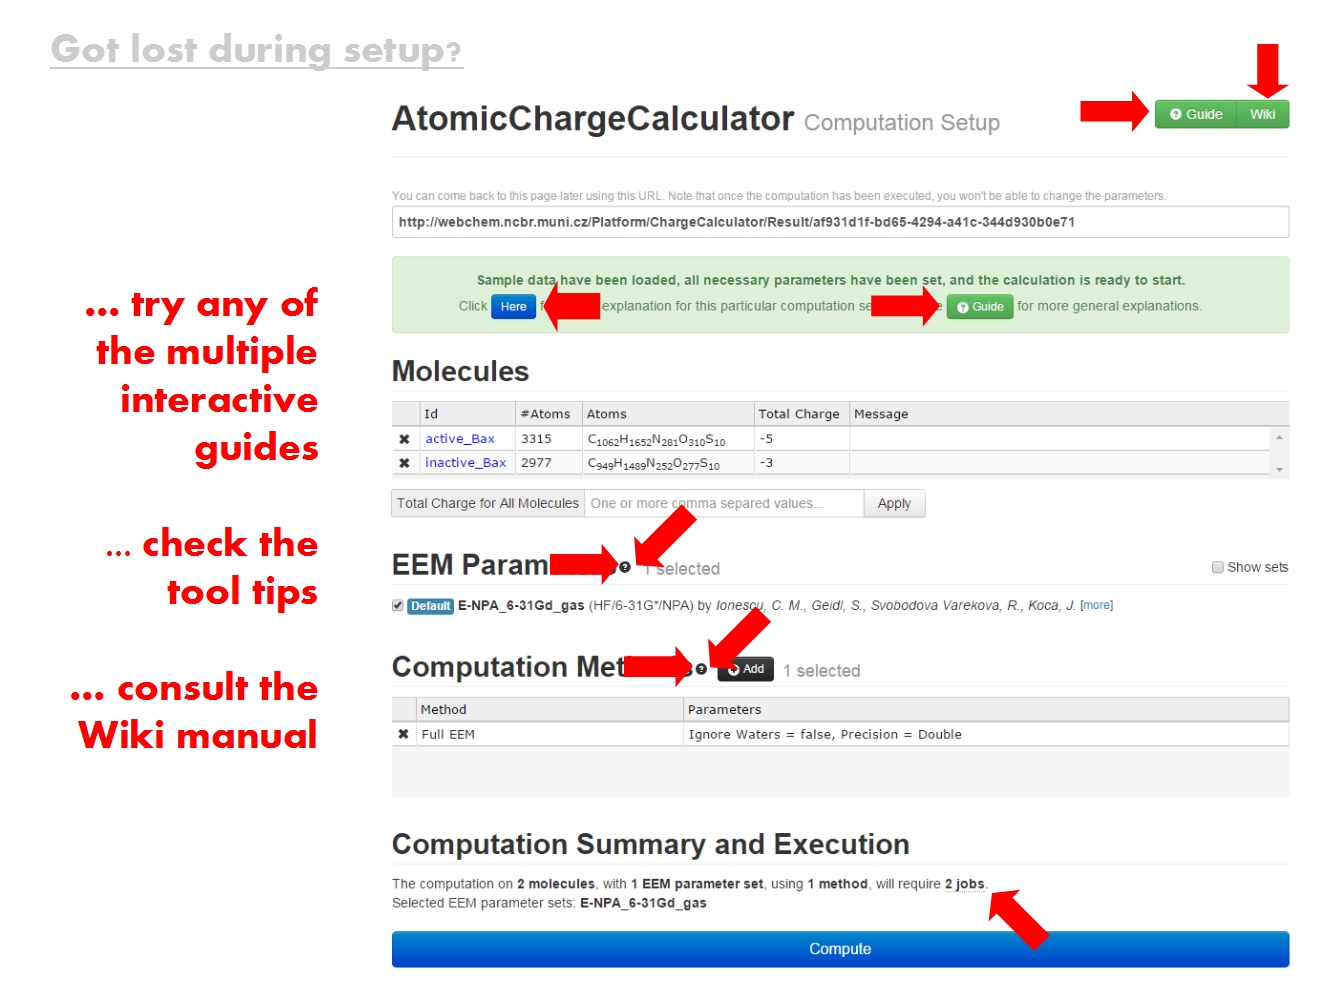
Once the calculation is complete, ACC updates the page with the unique URL which had been assigned to your computation. This page is organized into a Synopsis page covering results for all molecules, and one or more Specifics pages covering detailed results for each molecule.
Synopsis page
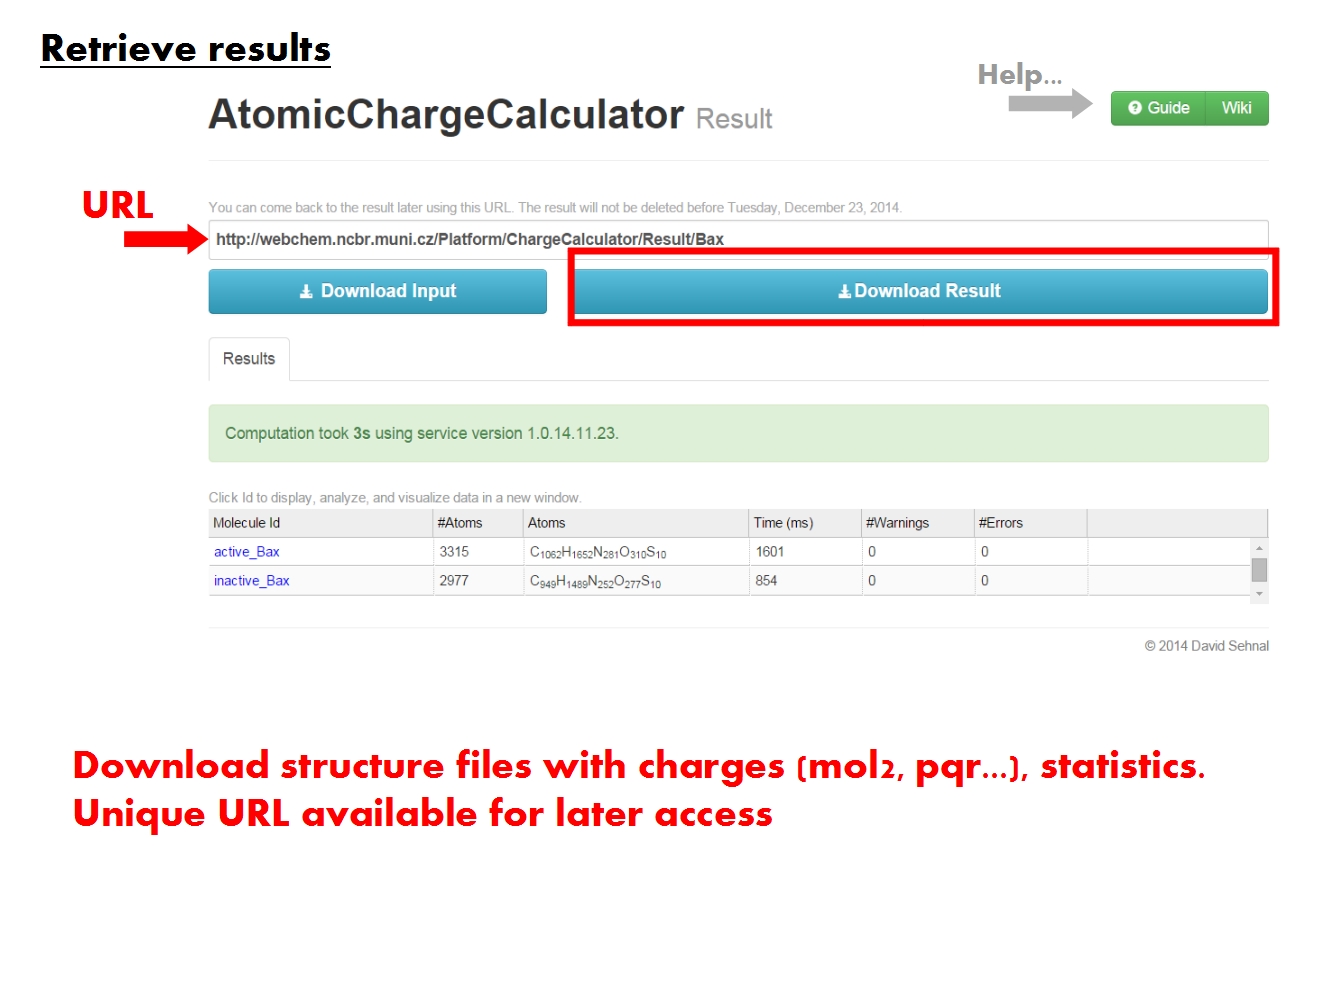
The ACC Synopsis page contains an overview of your computation, which might have consisted of multiple jobs for multiple molecules. You may download all the results now (molecular structure files containing atomic charges, statistics of the results, information about all jobs), or return to this page later via this URL. You may also inspect the results directly in your web browser.
For each molecule, the table lists the number of atoms and chemical formula, the time it took ACC to complete all jobs pertaining to that molecule, along with the number of warnings and errors it encountered. Note that if you have more molecules in the table, the timing for the first molecule is actually the total computation time for all jobs for all molecules.
In the table with molecules, click on a molecule name (Id) to visualize and analyze the results for this molecule in detail. Each molecule is identified according to the name of the input file, and comprises all structural elements in the input file, from simple compounds to biomacromolecular complexes made up of proteins, nucleic acids, ligands, ions, water, etc. For each molecule, your computation may have consisted of several jobs, in which case all the results will be available for analysis.
Specifics page
The ACC Specifics page contains the results of all atomic charge calculation jobs pertaining to a single molecule. The molecule is identified according to the name of the original input file. The Specifics page is organized into functional tabs which allow to view and analyze various parts of the data directly in your browser.
Summary
The Sumary tab contains an overview of the calculation, including warnings. Basic information about the input molecule and the setup of the calculation. The molecule comprises all structural elements present in the input file, regardless of annotations. Molecular formula, describing the atomic composition. Total charge of the molecule, distributed across the constituent atoms based on the Electronegativity Equalization Method (EEM). Total duration of all jobs for this molecule. Individual job timing available for download with the rest of the results.
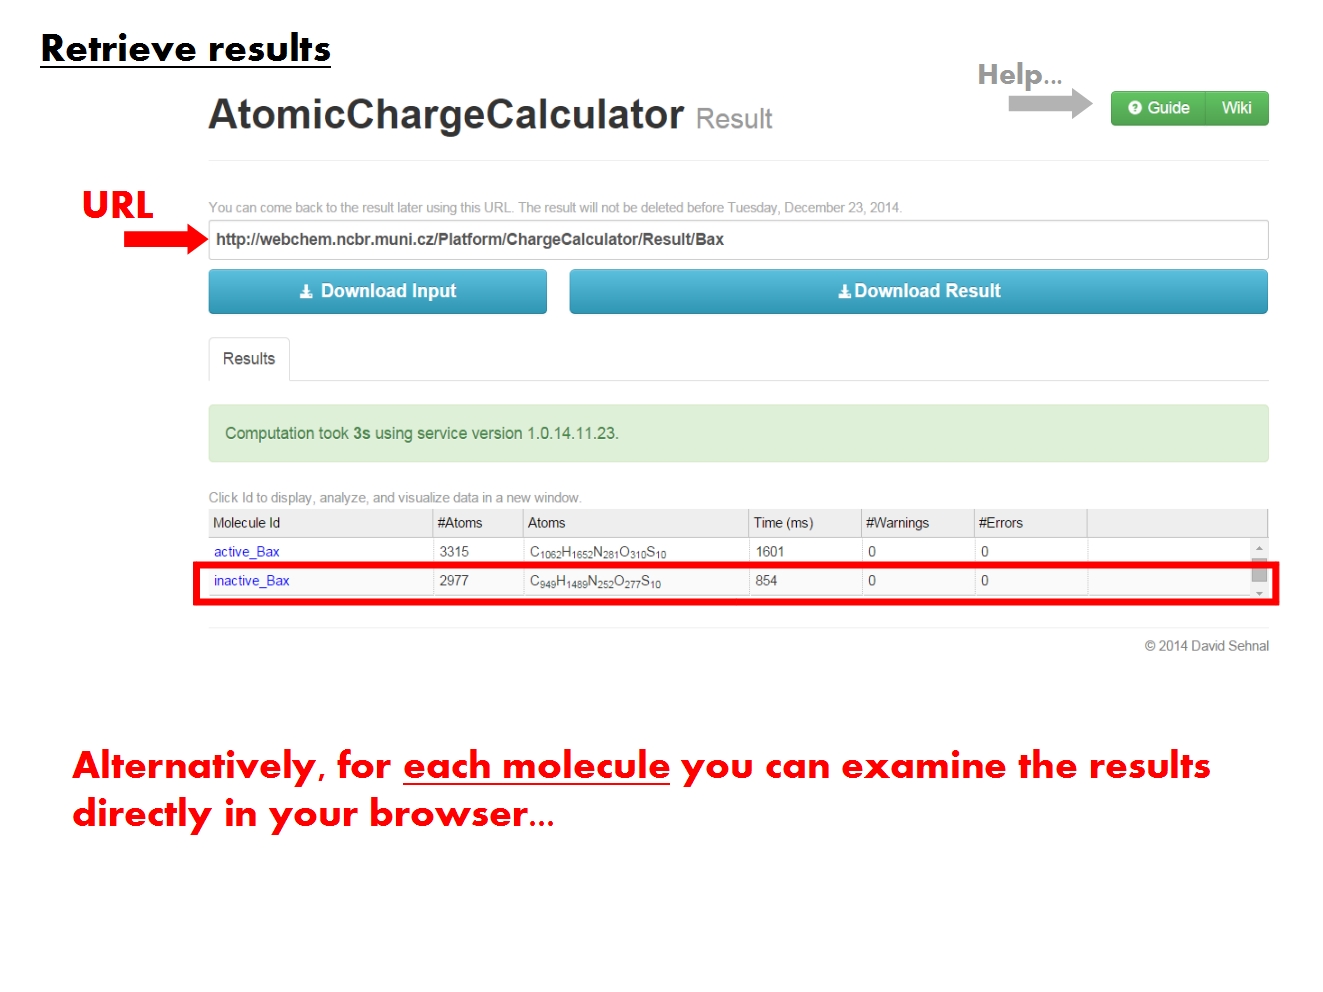
Multiple jobs may have been run for this molecule. A job is defined based on the molecule and its total charge, along with the EEM parameter set and computation method used. Each job produces a distinct set of charges with a unique ID encoding the EEM parameter set, method and total molecular charge. If the original input file contained values of atomic charges, these are also stored in a charge set named according to the input file, and marked by ref. All charge sets are available for analysis in the remaining tabs.
Warnings and errors generated while processing the input files and running the calculation. Each job will have its own list of errors and warnings. Jobs with errors generally do not produce any charge set, while jobs with warnings do. Warnings inform about some action taken under unexpected circumstances (e.g, defaulting to different parameters for certain atoms), or draw attention to aspects which may represent issues (e.g., insufficient number of H to satisfy all valences).
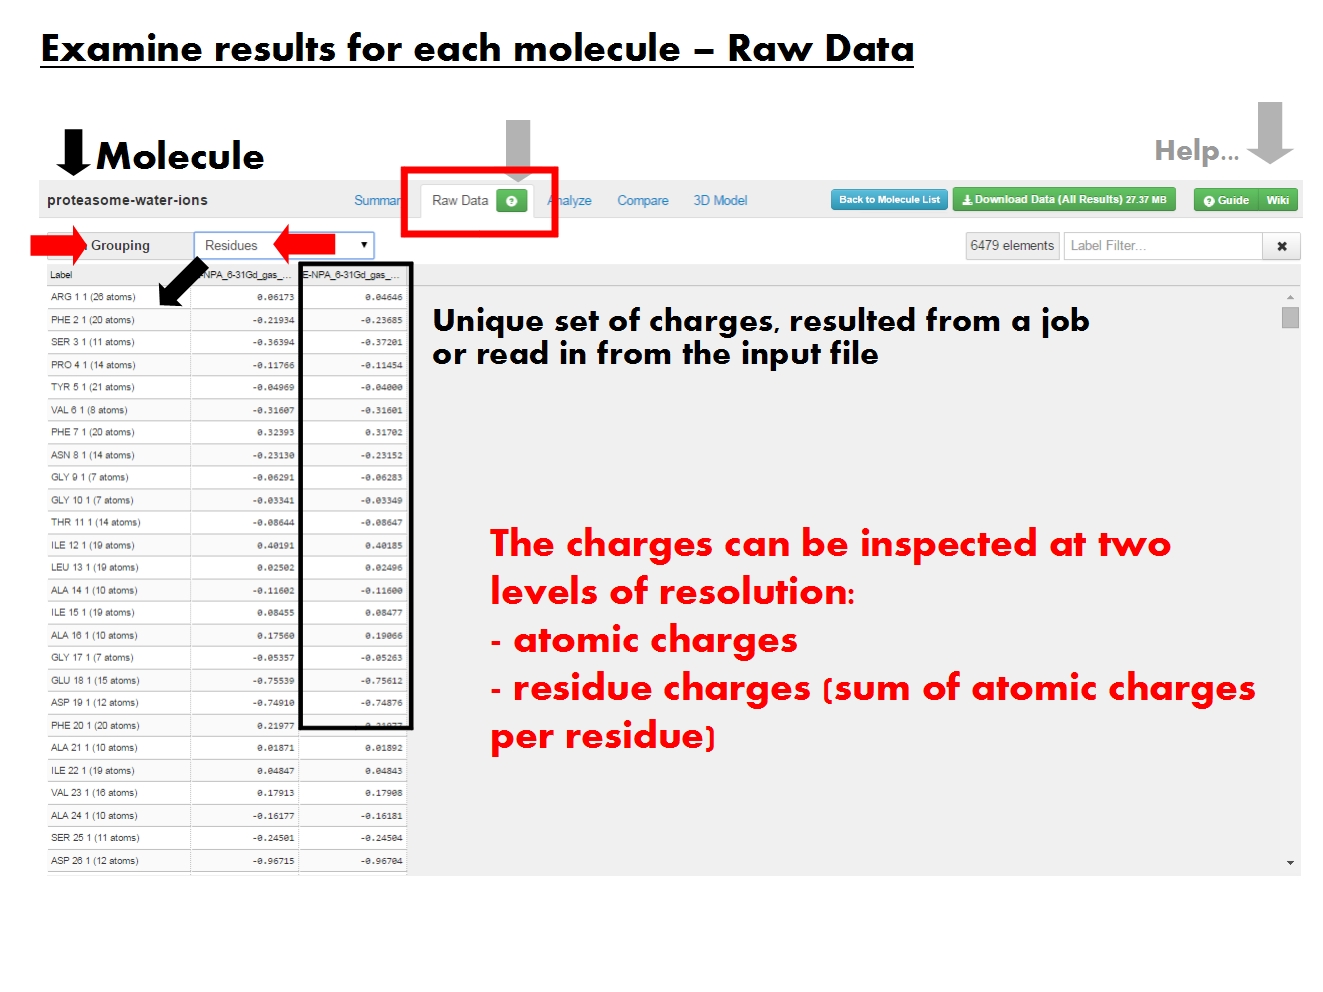
Raw Data
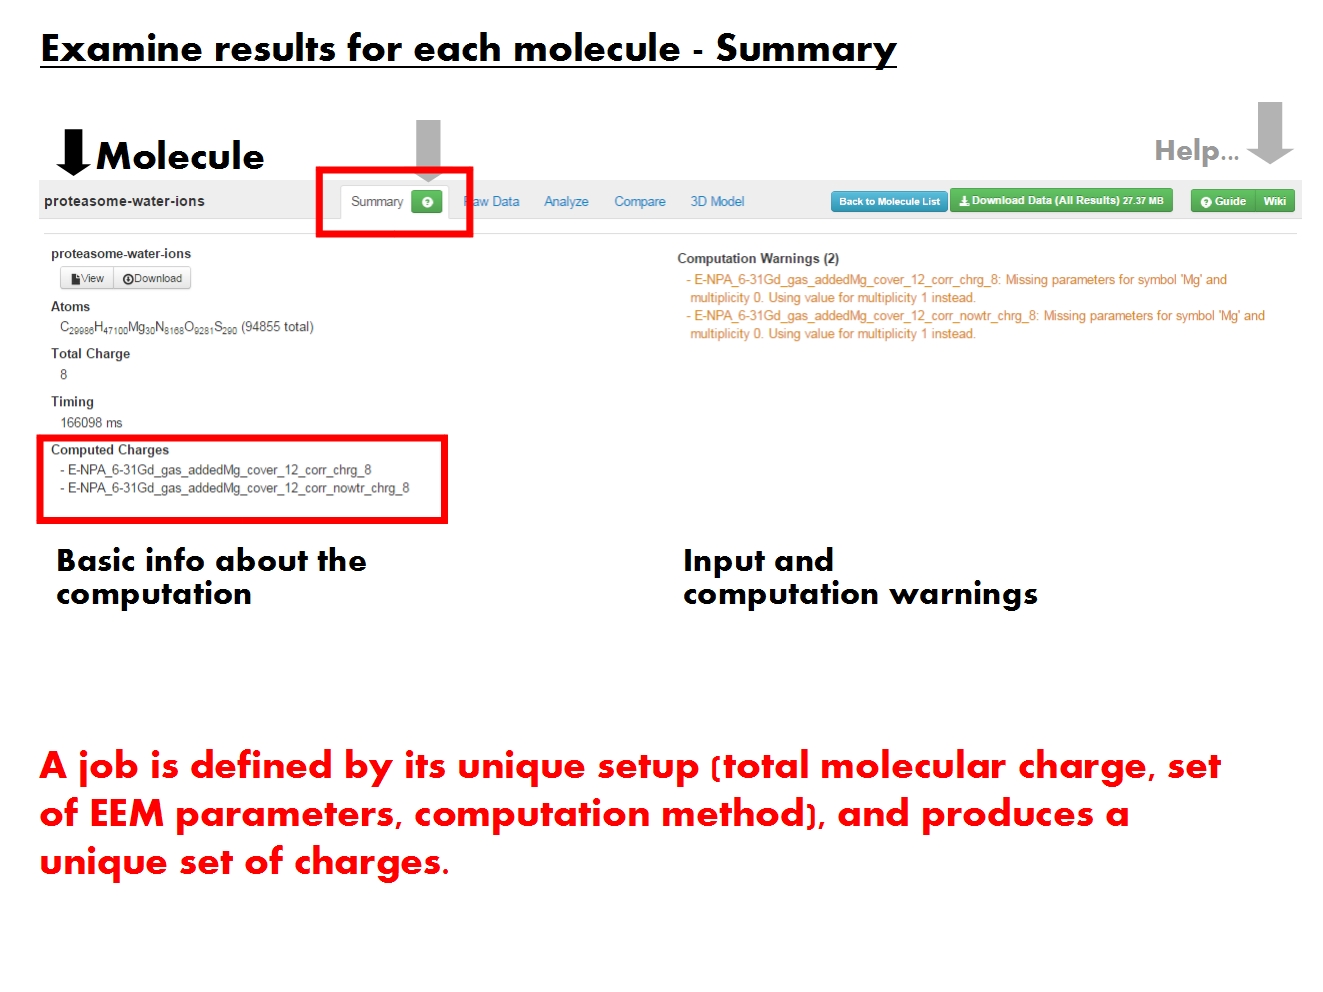
The raw data is available in tabular form, and refers to the actual values of atomic charges resulted from the EEM calculation, or read in from the input file. Residue charges may also be available. No additional statistics included here. Raw data available at more levels of resolution, termed atom grouping. Pick Atoms to list atomic charges, or Residues to list residue charges (sum of atomic charges for each residue). Residue charges available only if residue annotations are present in the input file.
Unique entry based on atom grouping. Labels for Atoms contain the atom type, atom name, atom serial number and residue of origin. Labels for Residues contain the residue name, residue serial number, chain identifier and number of atoms in the residue. Entries can be sorted according to atom or residue serial number.
Each job produced one set of charges, identified by the EEM parameter set, method and total molecular charge. Each column contains atom or residue charges resulted from a single job, or read from the input file (identified by the file name and marked by ref.
Filter table entries according to label. Regular expressions work. Counter records filter results.
Analyze
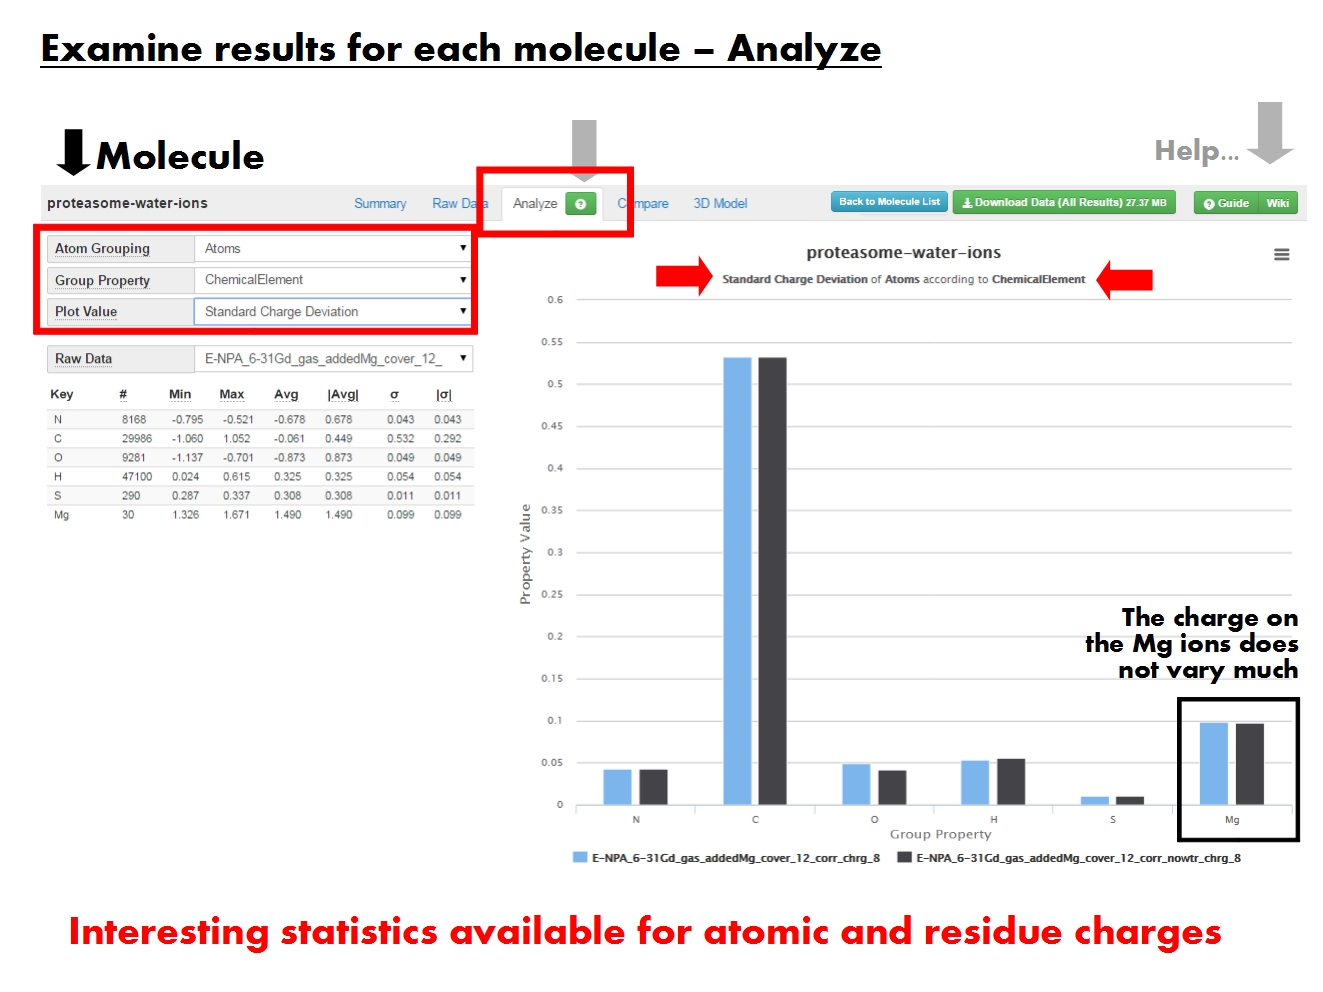
ACC provides several statistical descriptors for the results at more levels of resolution, in graphical and tabular form.
Displays the value of a statistical descriptor for charges on groups of atoms, according to a certain property. For example, the minimum charge of atoms according to their chemical element. Content of the graph dictated by the menus on the left.
Each column represents the results from a single job (defined by EEM parameter set, computation method, and total molecular charge), or read in from the input file (identified by the file name and marked by ref.
Dictate contents of the graph to the right, and of the Raw Data table below. Atom Grouping gives the level of resolution. Pick Atoms to display atomic charges, or Residues to display residue charges (sum of atomic charges for each residue). Residue-based statistics available only if residue annotations present in input file.
Group Property sets the specific property based on which the statistics are calculated for a certain Atom Grouping. For example, statistics on all atoms with a certain chemical element, or statistics on all polar residues.
Plot Value refers to the specific statistical descriptor displayed in the graph. For example, the standard deviation of the charge on atoms with a certain chemical element.
Tabular representation of all statistical descriptors for each set of charges (raw data) resulted from a single job, identified by EEM parameter set, computation method, and total molecular charge. Contents depend on the grouping and property menus above.
Compare
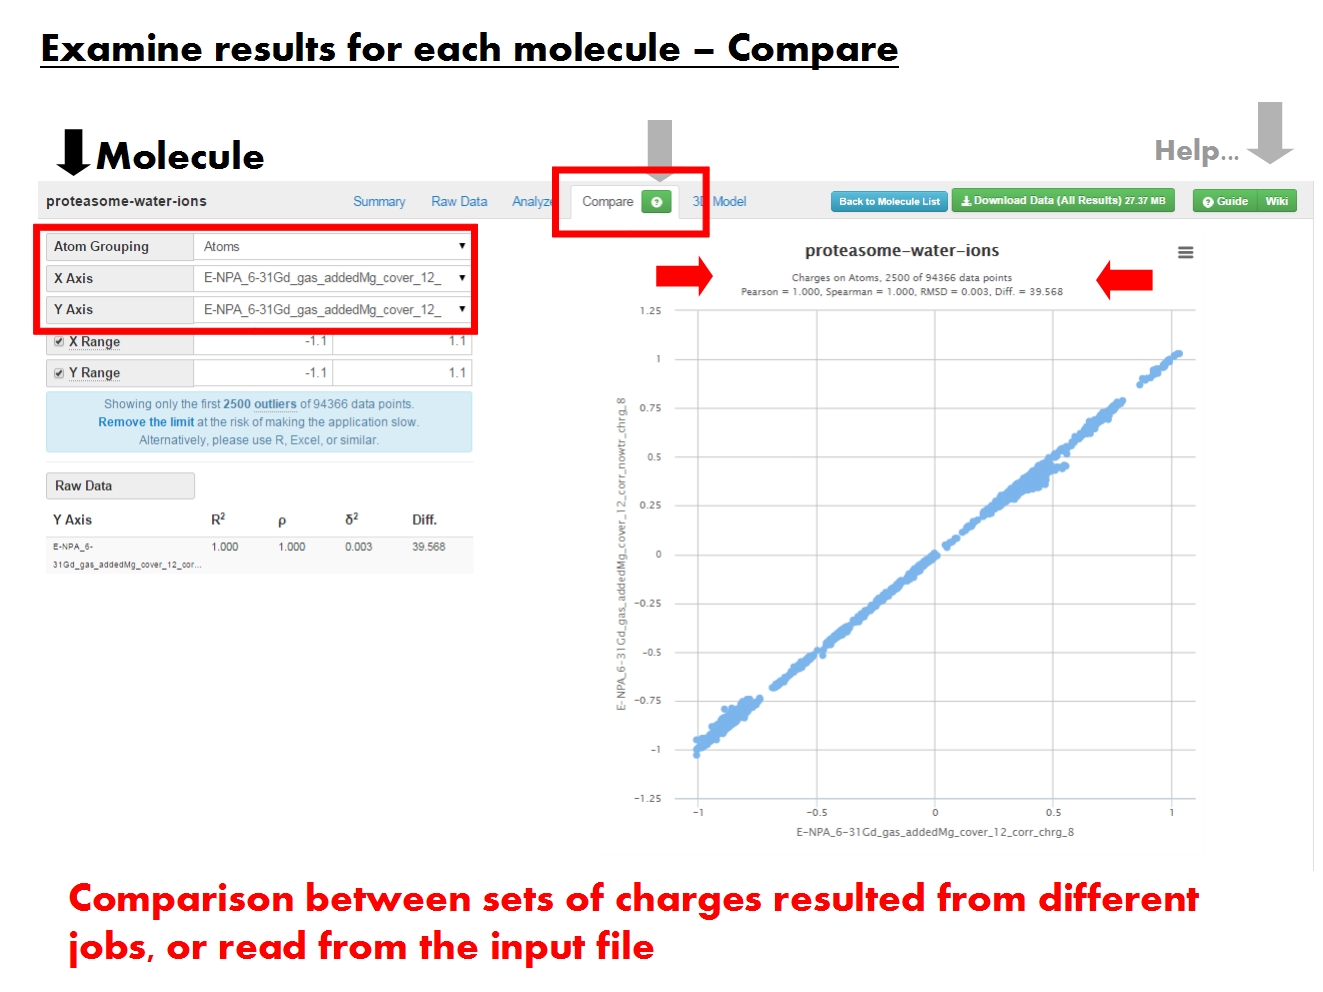
ACC allows to compare sets of charges at more levels of resolution, in graphical and tabular form. These sets of charges may have resulted from different jobs, or were read from the input file.
Statistical comparison between two sets of charges (X and Y axes) on groups of atoms. For example, comparison between formal residue charges given in the input file, and residue charges as computed by EEM. Content of the graph dictated by the menus on the left.
Dictate contents of the graph to the right, and of the Raw Data table below.
Atom Grouping gives the level of resolution. Pick Atoms to compare atomic charges, or Residues to compare residue charges (sum of atomic charges for each residue). Residue-based statistics available only if residue annotations present in input file.
Pick the sets of charges to compare. Each set of charges was produced by a single job (identified by EEM parameter set, computation method and total molecular charge), or was present in the input file (identified by the input file name and marked by ref).
If you find the default XY ranges unsuitable for a certain dataset, you may adjust them manually.
The number of data points depends on Atom Grouping. Comparison statistics computed using the entire datasets, but only 2500 data points display by default. Generally doesn't cause problems even when displaying 10000 data points. If in trouble, just reload the page.
Since outliers are displayed first, the graph might suggest the two charge sets are more dissimilar than the comparison statistics say.
Tabular representation of the statistical comparison between a specific set of charges (raw data) and all other charge sets available for this molecule. Contents depend on the grouping menu above."
3D Model
ACC allows a few basic charge visualization options to aid in interpreting the results of the atomic charge calculation. You may need to update your browser and driver version.
Dictate contents of the visualization window on the right. 3D visualization is generally memory consuming, so you should consider the settings before attempting to visualize the 3D model of your molecule.
For large biomolecular complexes, start with lower levels of display detail, and work your way up if you feel unsatisfied with the quality of the display. If in trouble, just reload the page. To reduce the complexity you may also choose to display the model based on residue positions (rather than atom positions). Only relevant if input file contains residue annotations.
Make sure your visualization settings are suitable, and click Update to display the 3D model of your molecule colored according to charges. Use Update whenever you modify the visualization options.
Visualization window, displaying a 3D model of your molecule, colored according to charges. Content depends on the visualization settings in the panel on the left. Mouse controls in the right bottom corner.
Atom Grouping gives the level of resolution. Pick Atoms to build the 3D model based on atomic positions and color it by atomic charges. Pick Residues to build the 3D model based on residue positions and color it by residue charges (sum of atomic charges for each residue). Residue positions and charges available only if residue annotations present in input file. Requires Update to take effect.
Pick the sets of charges used in coloring the 3D model of your molecule. Each set of charges was produced by a single job (identified by EEM parameter set, computation method and total molecular charge), or was read from the input file (identified by the input file name and marked by ref).
Instead of coloring by charges, it is sometimes useful to color by differences between two sets of charges. For example, to see how the presence of water changes the charge profile of the molecular surface.
Several basic modes available for displaying the 3D model, depending on the Atom Grouping. Requires Update to take effect.
" Each display mode has additional options you may wish to tweak. For example, display the protein using Cartoons, and the ligands using Balls and Sticks, but hide water molecules.
For large biomolecular complexes, start with lower detail. Requires Update to take effect.
If you find the default coloring scheme unsuitable, you may adjust it manually.
Further adjustment to the coloring scheme allows to emphasize the visual difference in charge distribution in different areas of the molecule. Emphasis increases with Value Gap.
Reset to default visualization options. Might require Update to take effect.
Return to the Table of contents.
