LiteMol:Hierarchy: Difference between revisions
No edit summary |
No edit summary |
||
| Line 20: | Line 20: | ||
*** '''Low Precision''' - If '''Low Precision''' = Off, the atomic coordinates are downloaded in full precision (3 decimal places). If '''Low Precision''' = On, then the coordinates are downloaded only with 1 decimal place. This change is almost unnoticeable in the visualized structure but less data are downloaded. | *** '''Low Precision''' - If '''Low Precision''' = Off, the atomic coordinates are downloaded in full precision (3 decimal places). If '''Low Precision''' = On, then the coordinates are downloaded only with 1 decimal place. This change is almost unnoticeable in the visualized structure but less data are downloaded. | ||
*** '''Server''' - By default, the data are downloaded from the CoordinateServer located at webchem.ncbr.muni.cz/CoordinateServer, however, this can be changed. | *** '''Server''' - By default, the data are downloaded from the CoordinateServer located at webchem.ncbr.muni.cz/CoordinateServer, however, this can be changed. | ||
** '''PDBe Updated mmCIF''' - Downloads the up-to-date structure from | ** '''PDBe Updated mmCIF''' - Downloads the up-to-date structure from PDBe server (e.g. www.ebi.ac.uk/pdbe/static/entry/1cbs_updated.cif). These structures are in mmCIF format. | ||
** '''URL''' - Downloads the structure from any internet location. | ** '''URL''' - Downloads the structure from any internet location. | ||
** '''File on Disk''' - Loads the structure from a file on your computer. The format of the file will be inferred from its extension. | ** '''File on Disk''' - Loads the structure from a file on your computer. The format of the file will be inferred from its extension. | ||
* '''Density Data from PDBe''' – Downloads the electron density data for a molecule specified by its PDB ID from PDBe server and creates a [[LiteMol:Hierarchy#Density Data (DD) | Density Data]] entity. | * '''Density Data from PDBe''' – Downloads the electron density data for a molecule specified by its PDB ID (or EMDB ID) from PDBe server and creates a [[LiteMol:Hierarchy#Density Data (DD) | Density Data]] entity. However, a much faster way to visualize densities is to create a [[LiteMol:Hierarchy#Molecule (M) | Molecule]] entity and then use the '''Density Streaming''' action. | ||
* '''Coordinate Streaming''' – Downloads the portion of structural data that is necessary for simple visualization of a molecule. If more data are needed later, they will be downloaded automatically. This behavior is particularly useful when working with extremely large molecules, whose full download may take more time, or when limited by hardware resources (slow/expensive Internet connection, memory) especially on mobile devices. You can specify what server should be used as the source of the data (e.g. http://webchemdev.ncbr.muni.cz/CoordinateServer or http://www.ebi.ac.uk/pdbe/coordinates). Creates a [[LiteMol:Hierarchy#Molecule (M) | Molecule]] entity. | * '''Coordinate Streaming''' – Downloads the portion of structural data that is necessary for simple visualization of a molecule. If more data are needed later, they will be downloaded automatically. This behavior is particularly useful when working with extremely large molecules, whose full download may take more time, or when limited by hardware resources (slow/expensive Internet connection, memory) especially on mobile devices. You can specify what server should be used as the source of the data (e.g. http://webchemdev.ncbr.muni.cz/CoordinateServer or http://www.ebi.ac.uk/pdbe/coordinates). Creates a [[LiteMol:Hierarchy#Molecule (M) | Molecule]] entity. | ||
* '''Download Data''' - Acquires a data file from a URL. The type of the file must be specified in advance (String (textual encoding) or Binary). Creates a [[LiteMol:Hierarchy#String Data (SD) | String Data]] or a [[LiteMol:Hierarchy#Binary Data (BD) | Binary Data]] entity. | * '''Download Data''' - Acquires a data file from a URL. The type of the file must be specified in advance (String (textual encoding) or Binary). Creates a [[LiteMol:Hierarchy#String Data (SD) | String Data]] or a [[LiteMol:Hierarchy#Binary Data (BD) | Binary Data]] entity. | ||
Revision as of 20:32, 12 April 2017
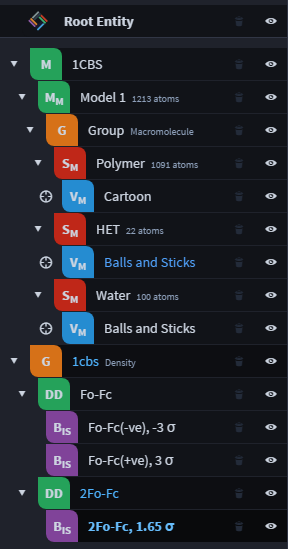
All data in LiteMol are organized in a hierarchy represented by entity tree. This tree is shown in LiteMol's left panel. When you click on an entity in the tree, you will see all actions applicable to this entity listed in the right panel.
This page lists all types of entities and explains the actions they provide.
Structures
Root Entity
The highest level of the hierarchy is the Root Entity, which is created at the beginning of LiteMol session. It represents the starting point of all actions and all other entities you create are its direct or indirect descendants.
Applicable actions:
- Molecule – Loads a structure of a molecule and creates a Molecule entity. The structure can obtained from several sources:
- CoordinateServer - Downloads the structure from an internet location that provides CoordinateServer functionality. These parameters can be set:
- Id - Specify the PDB identifier of the structure.
- Type - Can be either Full (coordinates of all atoms are downloaded) or Cartoon (only atoms necessary for cartoon visualization are downloaded, so the download will be faster).
- Low Precision - If Low Precision = Off, the atomic coordinates are downloaded in full precision (3 decimal places). If Low Precision = On, then the coordinates are downloaded only with 1 decimal place. This change is almost unnoticeable in the visualized structure but less data are downloaded.
- Server - By default, the data are downloaded from the CoordinateServer located at webchem.ncbr.muni.cz/CoordinateServer, however, this can be changed.
- PDBe Updated mmCIF - Downloads the up-to-date structure from PDBe server (e.g. www.ebi.ac.uk/pdbe/static/entry/1cbs_updated.cif). These structures are in mmCIF format.
- URL - Downloads the structure from any internet location.
- File on Disk - Loads the structure from a file on your computer. The format of the file will be inferred from its extension.
- CoordinateServer - Downloads the structure from an internet location that provides CoordinateServer functionality. These parameters can be set:
- Density Data from PDBe – Downloads the electron density data for a molecule specified by its PDB ID (or EMDB ID) from PDBe server and creates a Density Data entity. However, a much faster way to visualize densities is to create a Molecule entity and then use the Density Streaming action.
- Coordinate Streaming – Downloads the portion of structural data that is necessary for simple visualization of a molecule. If more data are needed later, they will be downloaded automatically. This behavior is particularly useful when working with extremely large molecules, whose full download may take more time, or when limited by hardware resources (slow/expensive Internet connection, memory) especially on mobile devices. You can specify what server should be used as the source of the data (e.g. http://webchemdev.ncbr.muni.cz/CoordinateServer or http://www.ebi.ac.uk/pdbe/coordinates). Creates a Molecule entity.
- Download Data - Acquires a data file from a URL. The type of the file must be specified in advance (String (textual encoding) or Binary). Creates a String Data or a Binary Data entity.
- Open Data File - Loads a data file from your computer. The type of the file must be specified in advance (String (textual encoding) or Binary). Creates a String Data or a Binary Data entity.
Molecule (M)
A Molecule entity represents a set of structural data for a molecule (one Molecule entity corresponds to one PDB entry or one mmCIF file).
Applicable actions:
- Model – Creates a model of the molecule (Molecule Model entity). Some PDB entries contain multiple models (mostly NMR structures). In such case, the sequential number (Index) of desired model can be specified.
- Density Streaming - TODO
- PDBe Validation Report – Downloads validation data for this molecule from PDBe and creates Validation Report entity.
- Ligand Validation Report - TODO
- PDBe Sequence Annotations – Downloads sequence annotation data for this molecule from PDBe (collected from sources such as UniProt, InterProt, Pfam etc.) and creates Sequence Annotations entity.
Molecule Model (MM)
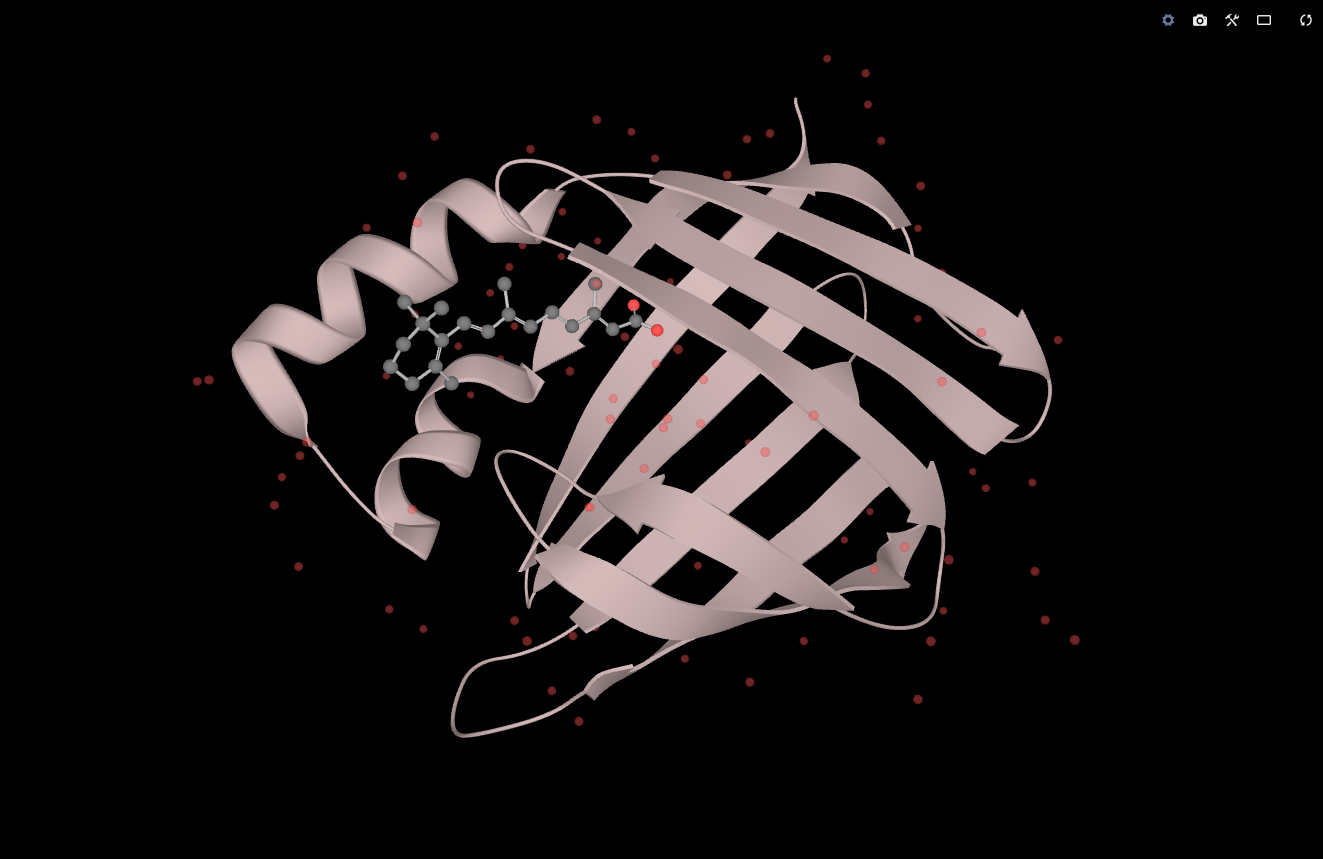
A Molecule Model entity represents a static model of a molecule, i.e. 3D coordinates of each atom. (If your PDB entry contains multiple alternative models, each of them will be in a separate Molecule Model entity.)
Applicable actions:
- Selection – Selects a part of the model and creates Molecule Model Selection entity. Selections are defined using selection algebra language.
- Assembly – Some PDB entries contain information about how multiple copies of the molecule should be positioned in space in order to create a biological assembly (e.g. a virus capsid). Alternatively, just a part of the model can constitute a biological assembly (e.g. the model contains a dimer while a monomer is present in vivo). This action applies this information to your model and creates a new model containing the biological assembly. Some PDB entries provide more than one assembly.
- Crystal Symmetry – Creates a new model containing the original molecule and its closest neighbours in crystal structure. Two modes are available: Interaction shows only those atoms that are within the specified radius (in Angstroms) from the original structure, Mates shows all copies of the structure that have at least one atom within this radius. This action is obviously not available for NMR structures.
- Macromolecule Visual – Creates a visual representation of the model. If the model contains several types of molecules (e.g. protein + ligand), these are organized in a group of selections and appropriate visualization is used for each selection (e.g. Cartoon for protein but Balls and sticks for ligand). The same visuals are created automatically when the Molecule Model entity is created.
- Visual – Creates a visual representation of the model. As opposed to Macromolecule Visual, this option is less automatic but more flexible. Type, coloring, and other attributes of created Visual can be specified. Find more about these settings here.
- Coordinate Streaming – TODO: explain why is usefull
- Update Model – Applicable when multiple models are included in this PDB entry (typical case for NMR structures). This action will remove the current model and create a new model with specified index. Please keep in mind that this will remove all the changes you have applied to the current model! If you don't want to loose these changes, go to the superior Molecule entity and create a new model besides the current model.
Group (G)
This type of entity is merely used to organize multiple entities that are logically connected. An example is a group of selections containing different parts of a model (protein, ligand, and water) or a group of sequence annotations obtained from the same database.
Molecule Model Selection (SM)
This is an entity representing a subset of a molecule model. An example is one protein chain, one atom, or a set of all alanine residues. A selection can be created from either a Molecule Model entity or a Molecule Visual entity. Selections are created using selection algebra language.
Applicable actions:
- Visual – Create a visual representation of this selection. Type, coloring, and other attributes of created Visual can be specified. Find more about these settings here.
- Update Selection - TODO
Density Data (DD)
Represents a three-dimensional map of electron density. Two types of maps are available for most crystal structures: 2Fo-Fc and Fo-Fc. Only one map is available for cryo-EM structures.
Applicable actions:
- Surface – Creates a visualization of the density isosurface with given isovalue (Density Visual entity).
- Interactive Surface – Creates a density isosurface which is shown only for a region of the molecule when you click on that region (Interactive Surface entity).
- Update CCP4/Map – Allows you to see the properties of this density map, such as standard deviation, minimum, maximum, and mean value.
Visualization
Molecule Visual (VM)
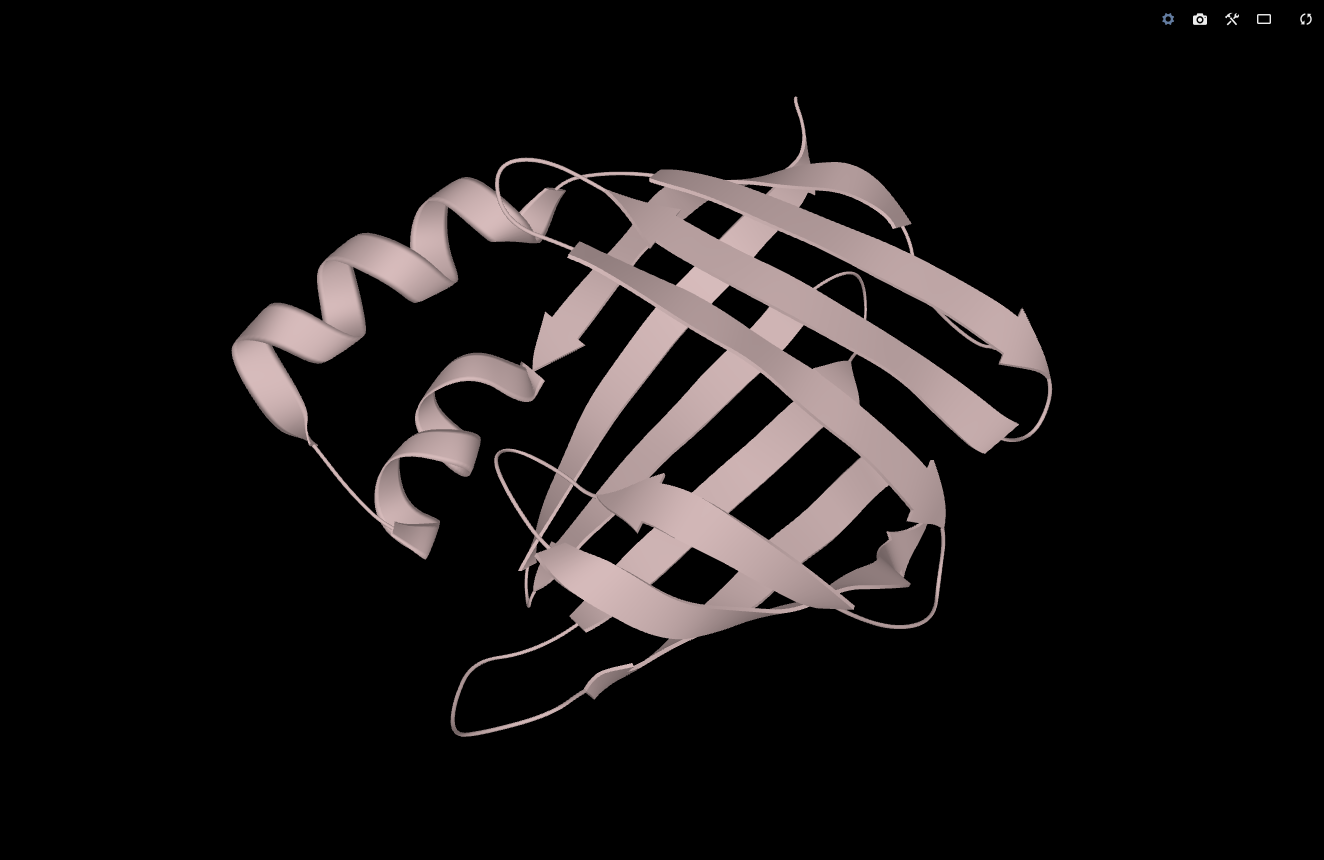
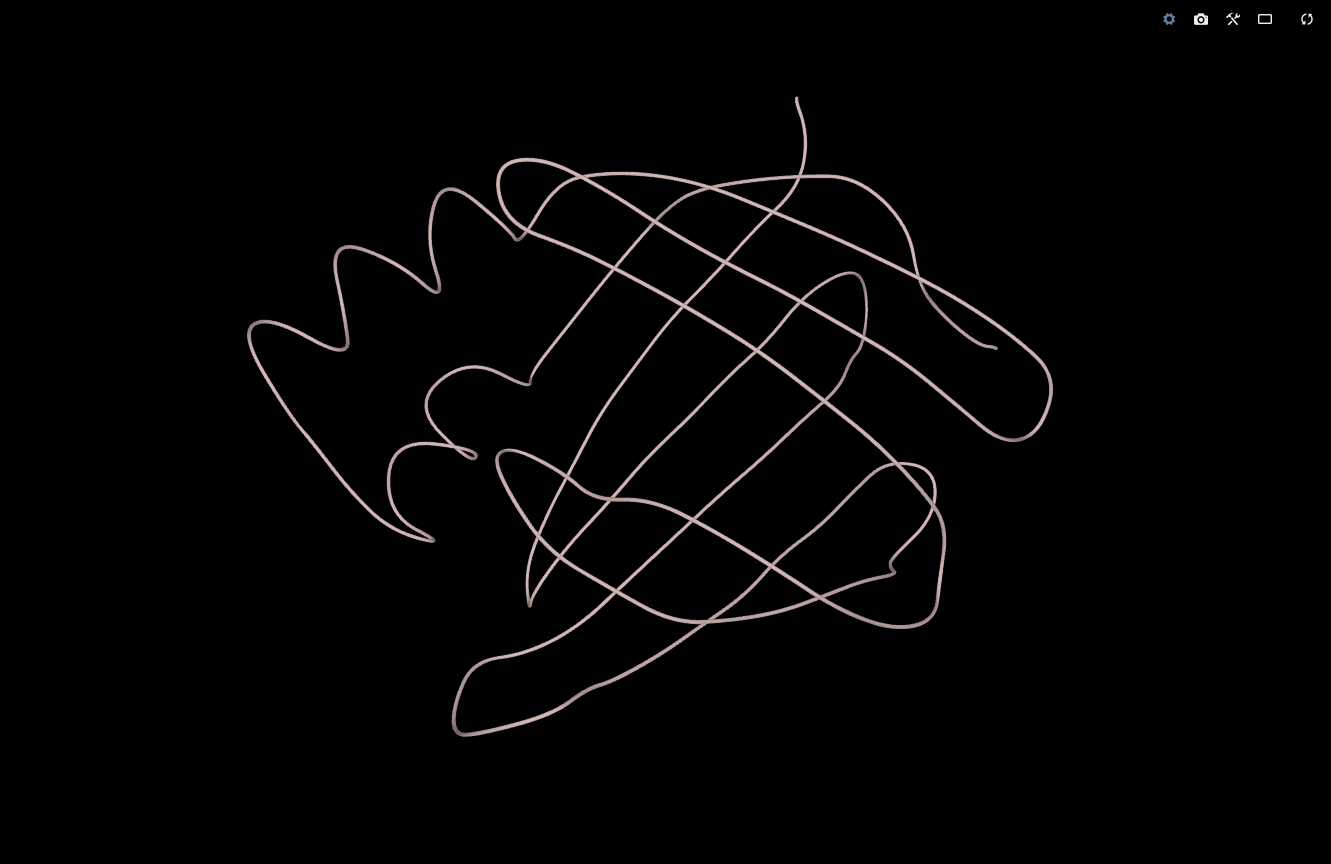
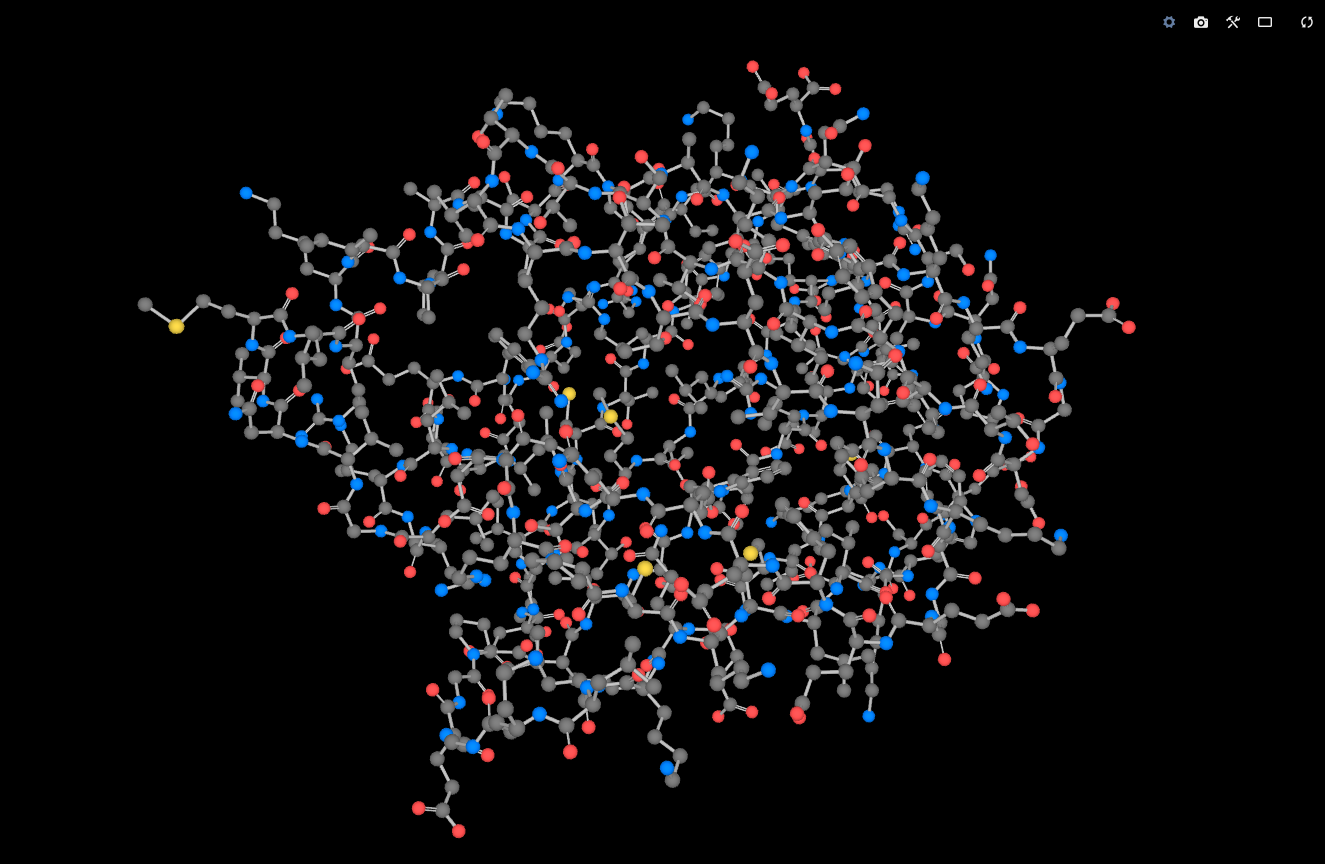
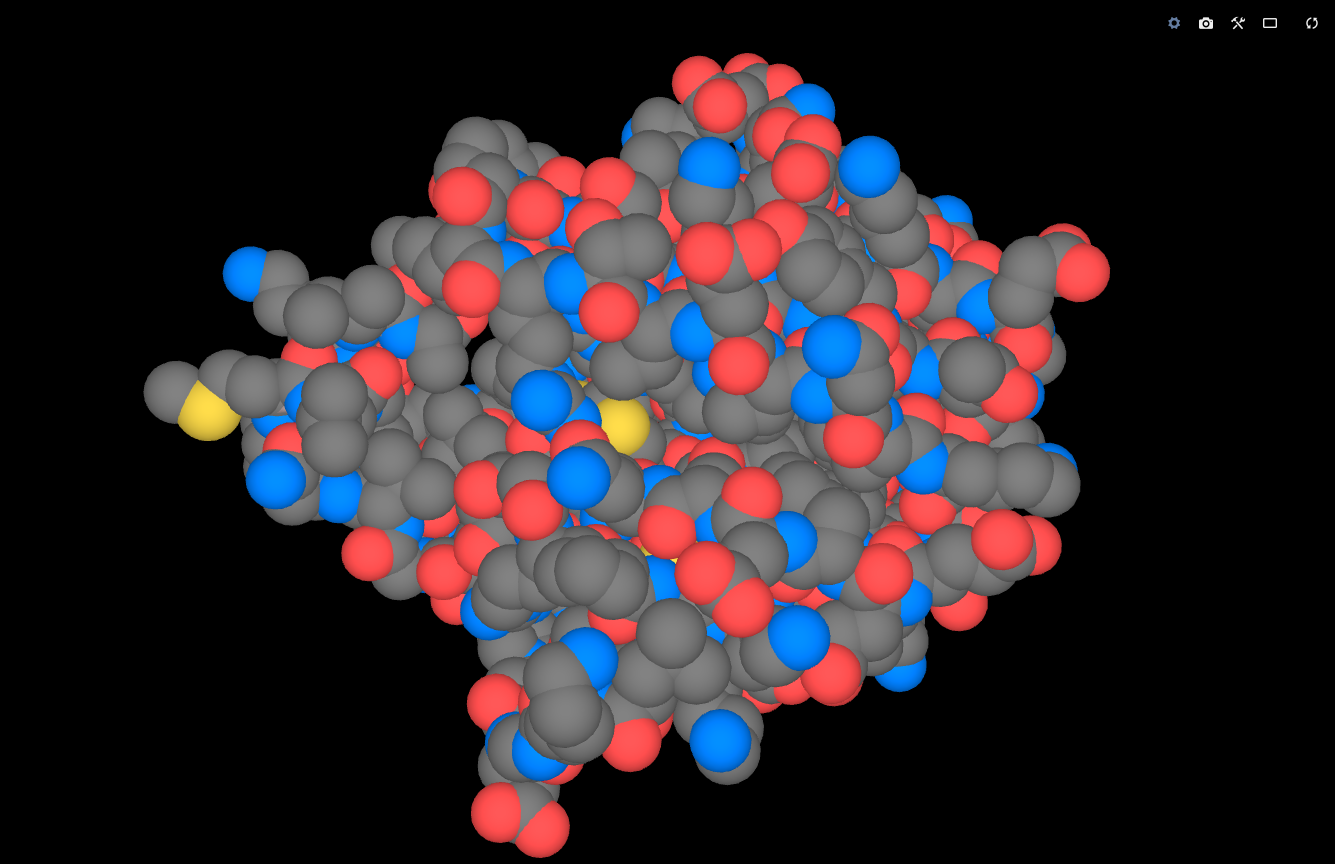
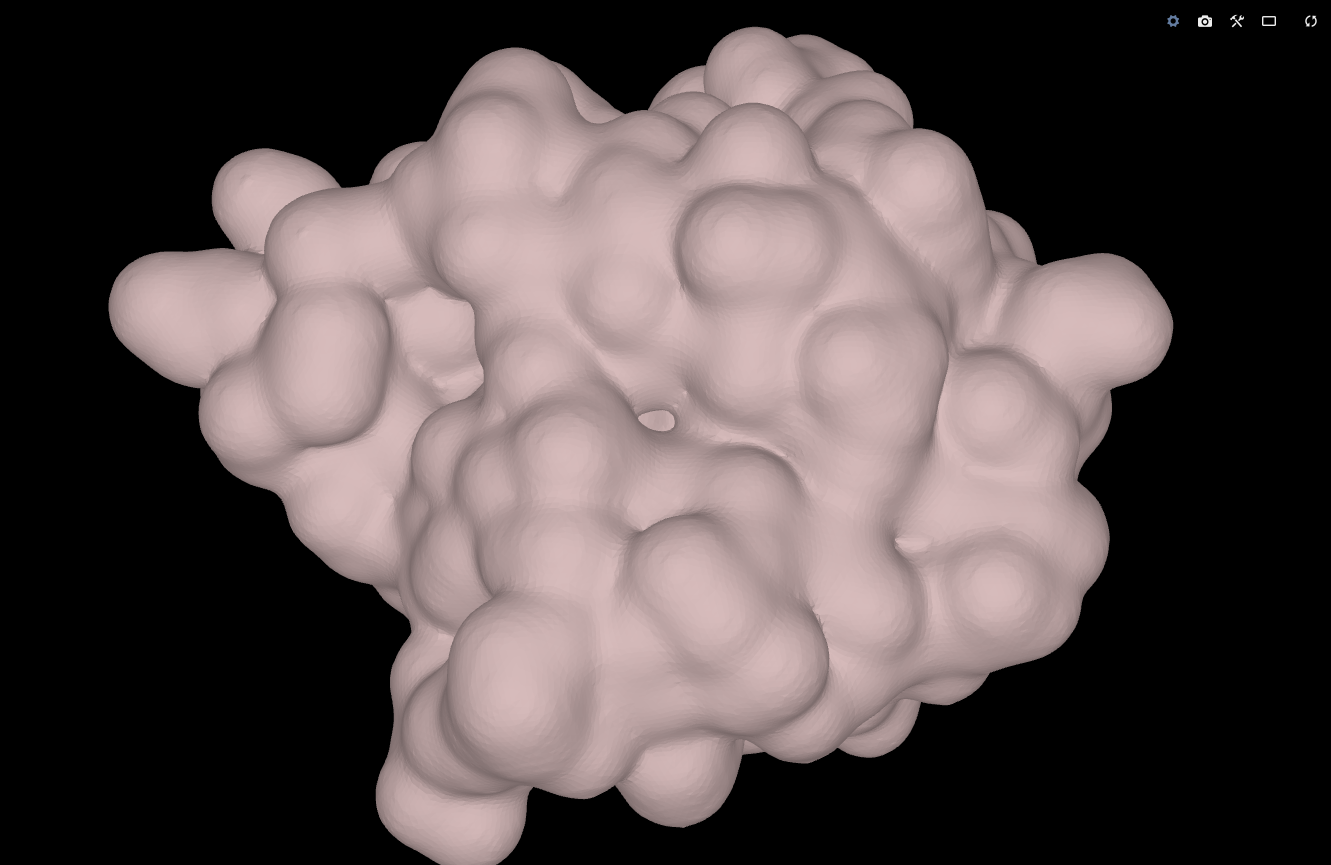
A Molecule Visual is simply a visualization of a Molecule Model or its part. It is defined mostly by its type and coloring. These can be changed in Update Visual action. Click on the “+” icon next to “Type” or “Coloring” to modify other attributes. Some attributes are only available for certain types of visualization.
Applicable actions:
- Selection – Selects a part of the model and creates Molecule Model Selection entity. Selections are defined using selection algebra language.
- Update Visual – Allows you to change the type of visualization and other attributes.
List of attributes:
- Type – One of the following:
- Cartoon – Schematic representation of the backbone with distinction of helices, sheets, and unstructured regions.
- C-α Trace – Simplified wire-like representation of the backbone (no side-chains).
- Balls and Sticks – Atoms are represented by balls, bonds are shown as sticks connecting them. Keep in mind that most structures from X-ray and cryo-EM experiments do not provide positions of hydrogen atoms, so these are not visible in Ball and Sticks representation. There are some extra attributes that you can modify:
- VDW – Indicates whether all atoms are shown as balls with uniform radius (VDW = Off) or ball's radius is based on the element's van der Waals radius (VDW = On).
- Scale – (Only when VDW = On) The ratio between the ball's radius and the element's van der Waals radius.
- Atom Rds – (Only when VDW = Off) The radius of the balls in Angstroms.
- Bond Rds – The width (radius) of the sticks.
- Bond – Color of the sticks.
- VDW Balls – Shows atoms as balls width radii corresponding to their van der Waals radii.
- Surface – Shows the smoothed boundary surface of the space “filled” by the molecule. There are some extra attributes that you can modify:
- Probe Radius – How much space around an atom is considered as “filled” by this atom.
- Smoothing – With lower values curvature of the surface around individual atoms will be more noticeable. With higher values the surface will be smoother.
- Auto Detail - If set to On, the optimal level of detail is automatically derived from the size of the molecule. If set to Off, the level of detail can be adjusted manually (see the next item).
- Detail – Defines how precisely the surface should be visualized. While higher detail provides nicer pictures for small molecules, lower detail is a better option (faster and less resource-demanding) when visualizing larger molecules.
- Wireframe – Toggles between visualization as a solid surface (Wireframe = Off) and a transparent wire-like representation (Wireframe = On).
- Detail – Defines how precisely the molecule should be visualized and can range from Very Low to Very High. While higher detail provides nicer pictures for small molecules, lower detail is a better option (faster and less resource-demanding) when visualizing larger molecules. If you choose Automatic, LiteMol will infer the optimal level of detail from the molecule's size.
- Coloring – One of the following:
- Chain ID – Every chain will be shown in a different color.
- Entity ID – The same as Chain ID but identical chains are shown in the same color.
- Entity Type – Every type of entity (polymer, non-polymer, water) is shown in a different color.
- Residue Name – A different color is used for each type of residue.
- Element Symbol – A different color is used for each element.
- Rainbow (Chain) - TODO
- Rainbow (Entity) - TODO
- Uniform Color – One selected color is used for the whole Visual.
- Highlight – The color in which this Visual will be temporarily colored when hovering over the Visual entity in the entity tree. When the cursor is placed on an atom or residue, it will be colored in the same way.
- Selection – If you create a Selection from this Visual, it will be distinguished from the rest of the Visual by having this color.
- Opacity – The level of transparency of the Visual. The value 1 means totally opaque whereas the value 0 means totally transparent (thus invisible).
Please keep in mind that changing the type of a Visual will in fact remove the current visual and replace it with a new one, so all changes you have applied to the current Visual (such as creating a selection from it) will be lost! You can go to the superior entity and create a new Visual besides the current Visual.
Density Visual (VDD)
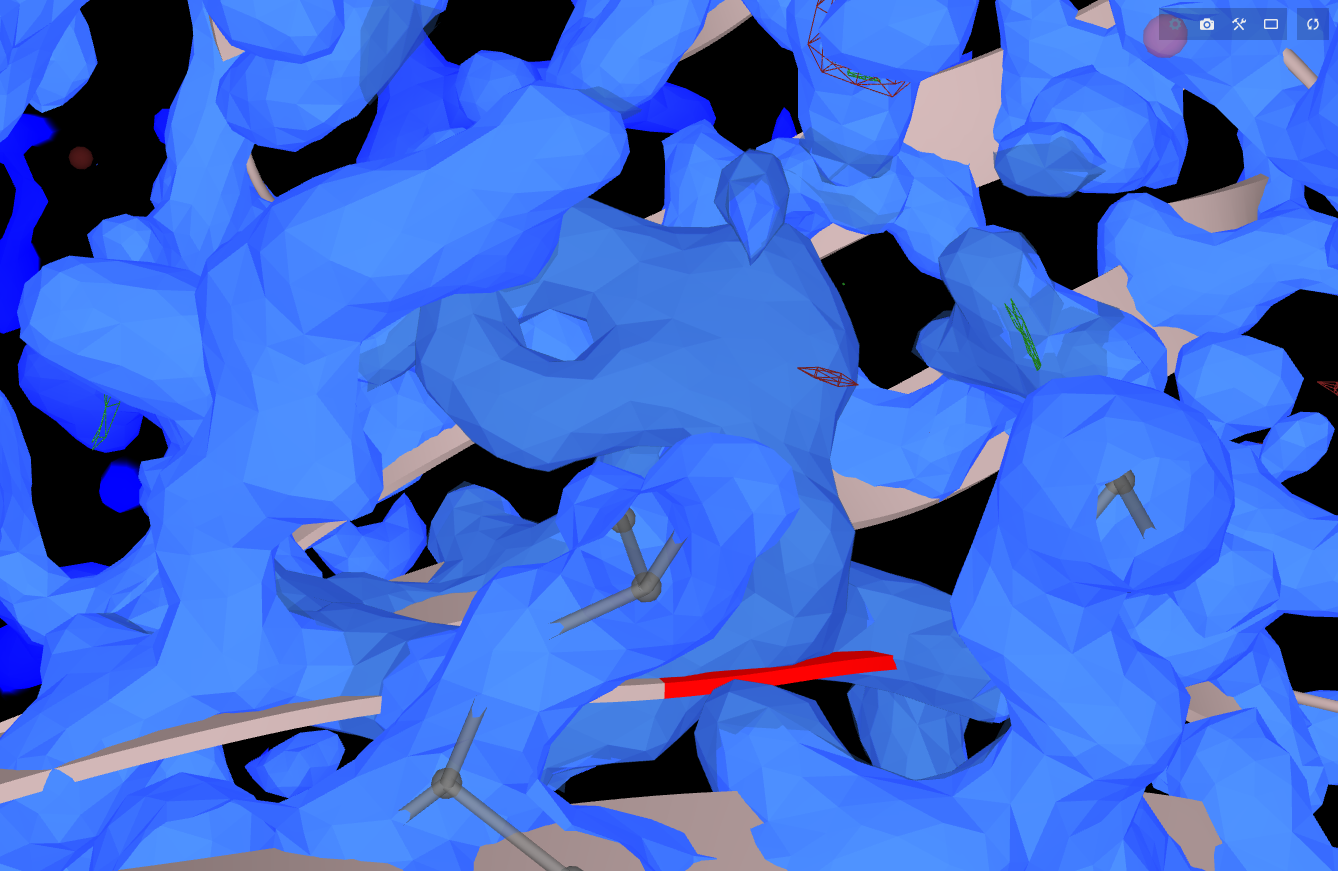
Represents an isosurface of electron density, i.e. the surface in 3D connecting all the points with the value of electron density equal to a specified isovalue.
Applicable actions:
- Update Surface – Allows you to change the attributes of the visualization.
List of attributes:
- Iso value – The isovalue of electron density used for the visualized surface.
- Relative - TODO
- Color – The color of the surface.
- Opacity – The level of transparency of the surface. The value 1 means totally opaque whereas the value 0 means totally transparent (thus invisible).
- Wireframe – Toggles between visualization as a solid surface (Wireframe = Off) and a transparent wire-like representation (Wireframe = On).
Interactive Surface (BIS)
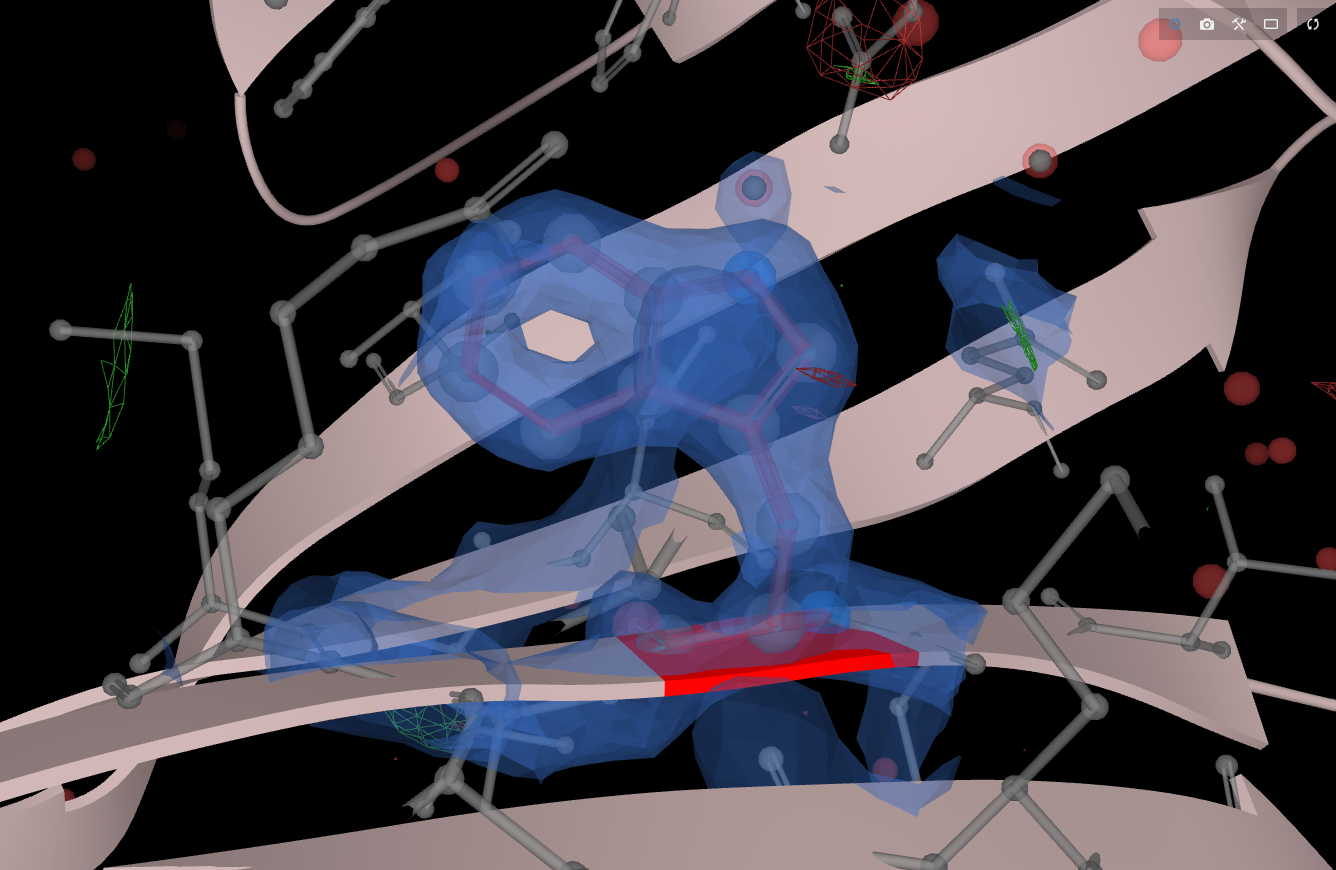
This is a visualization of an isosurface of electron density, just as Density Visual. The difference is that this surface is shown only when you click on a residue or an atom in the structure. The surface is shown only for the region around the selected residue or atom. An advantage of this interactive visualization is that the relevant region of density surface is not hindered by the rest of the molecule.
Three default Interactive Surfaces are created automatically when loading density data: blue surface corresponds to isovalue 1.5 in 2Fo-Fc density map. Green and red surfaces correspond to isovalues +3 and -3 in Fo-Fc density map.
Applicable actions:
- Update Interactive Surface – Change the attributes of the visualization. These attributes are the same as in the case of Density Visual entity. An extra attribute is Radius, which allows you to change the size of the region for which the isosurface is shown. Attribute Show toggles between interactive visualization around the selected region (Show = Around Selection) and static visualization of the whole map (Show = Everything, practically equivalent to Density Visual entity).
Annotations
Validation Report (VR)
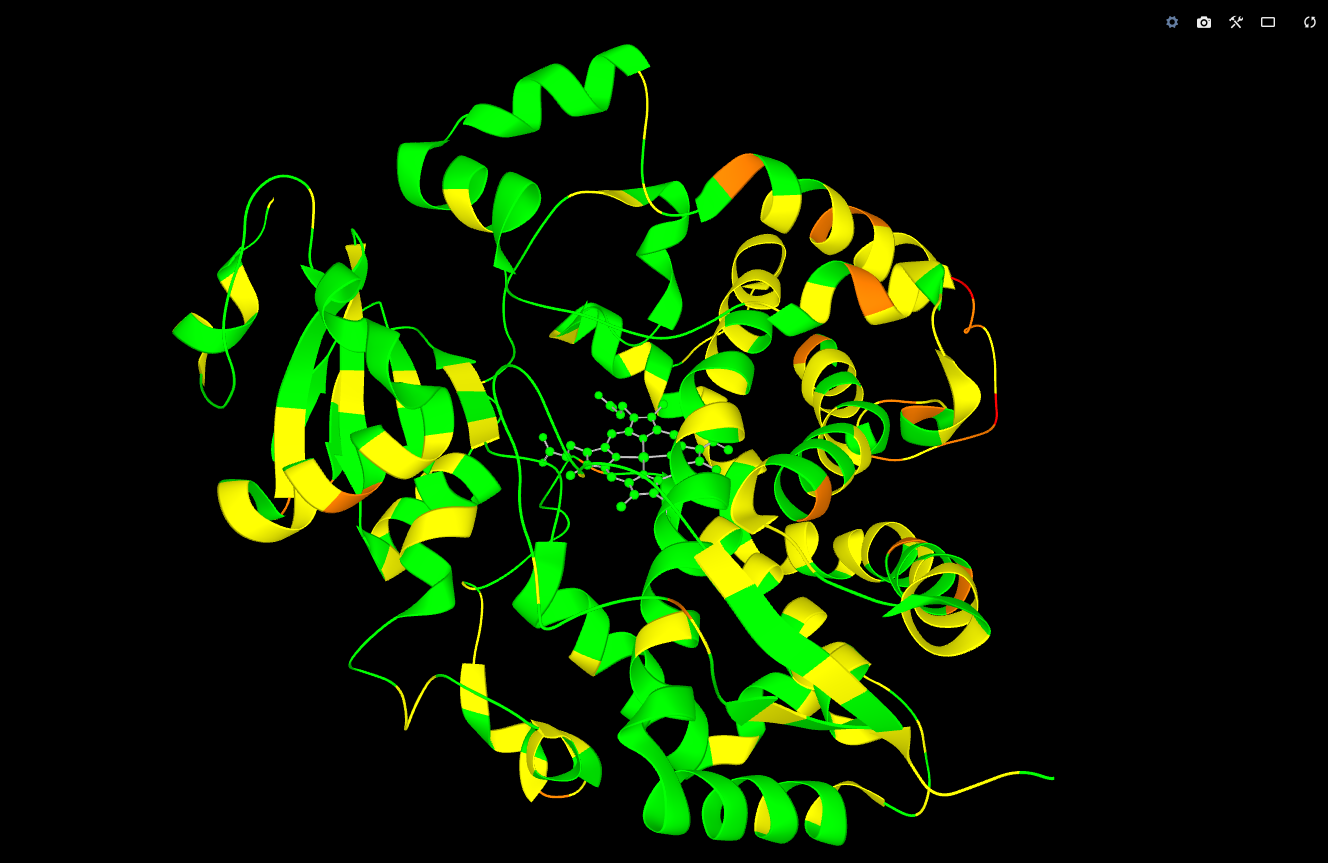
Represents validation data for this molecule from PDBe. The full validation report in PDF can be downloaded from the PDBe site (find your molecule, click Details in Experiments and Validation section, and then Full Validation Report in the right panel). An example of a validation report is available here.
Applicable actions:
- Apply Coloring – Residues will be colored according to the number of geometric quality criteria for which they contain at least one outlier: green = 0, yellow = 1, orange = 2, and red = 3 or more.
TODO: Can be also for ligands (+picture).
Sequence Annotations (SA)
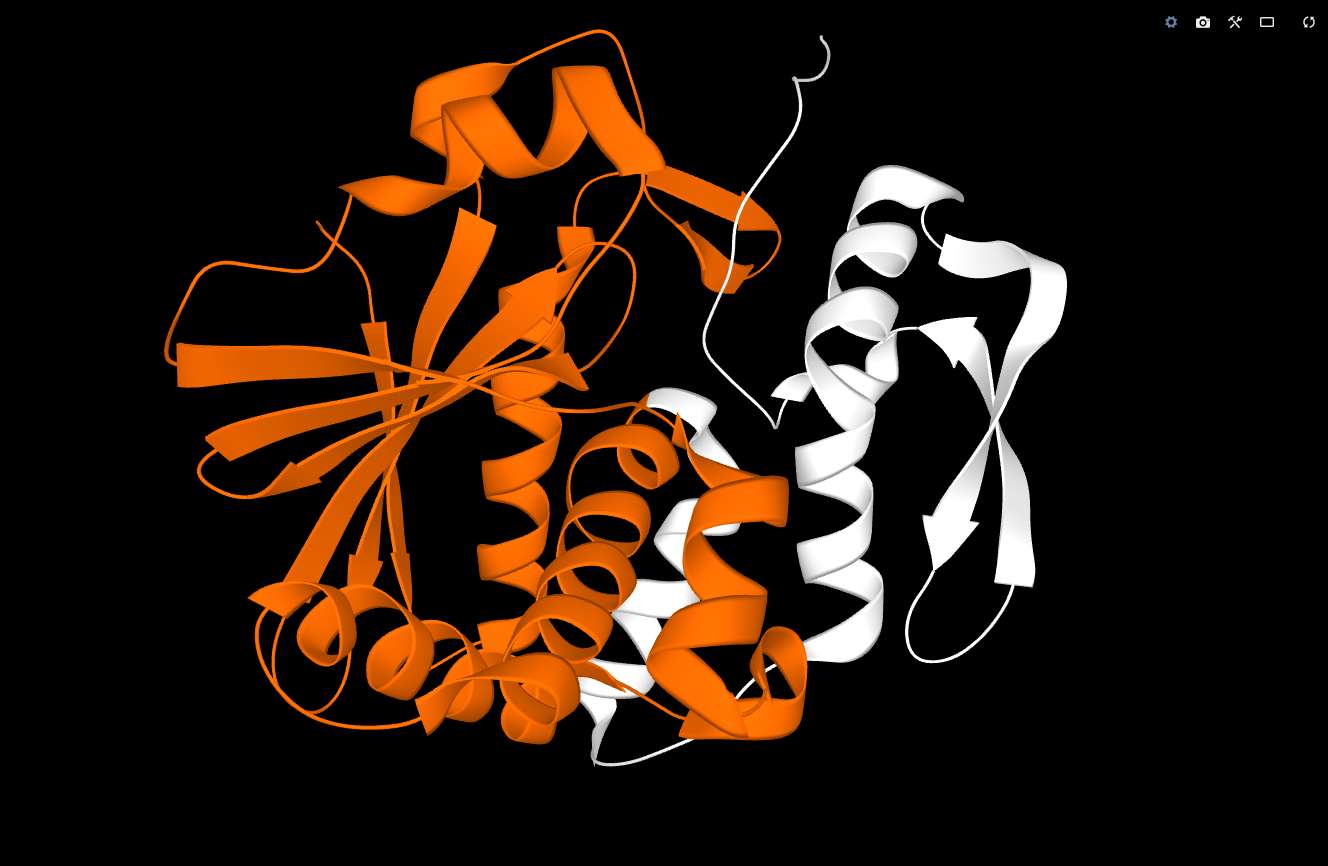
Represents a collection of sequence annotations from PDBe, grouped by the source database.
Sequence Annotation (SA)
Represents a single sequence annotation, i.e. assignment of a name to a part of the structure. When you hover above this entity or click on it, the corresponding part of the structure will be shown in a distinctive color.
Applicable actions:
- Update PDBe Sequence Annotation – Allows you to change the color used for this part of the structure.
Raw Data
TODO
String Data (SD)
TODO
Binary Data (BD)
TODO
CIF Dictionary (CD)
TODO