NEEMP:Reports: Difference between revisions
Appearance
No edit summary |
No edit summary |
||
| Line 1: | Line 1: | ||
Along with '''NEEMP''' we provide an handy python script to generate charge correlation graphs and quality assay reports, namely '''''nut-report.py'''''. To run the above-mentioned script, ''python'' and ''R'' packages must be installed in the system. | |||
'''''Figure 5''''' displays the required input file in which for each atom the difference between the ''reference QM charge'' and the ''EEM charge'' is calculated. Such a file can be obtained running '''NEEMP''' in ''quality validation'' mode with the option <code>--chg-stats-out</code> (see [[NEEMP:Examples#Example 8 - Quality validation | example]] or [[NEEMP:Modes#Quality validation | quality validation]] for details). | |||
<br style="clear:both" /> | <br style="clear:both" /> | ||
Revision as of 08:49, 29 June 2016
Along with NEEMP we provide an handy python script to generate charge correlation graphs and quality assay reports, namely nut-report.py. To run the above-mentioned script, python and R packages must be installed in the system.
Figure 5 displays the required input file in which for each atom the difference between the reference QM charge and the EEM charge is calculated. Such a file can be obtained running NEEMP in quality validation mode with the option --chg-stats-out (see example or quality validation for details).

.
To generate the graphs the scripts must be called in the simple following way:
First:
- ./nut-report.py charge-stat-file
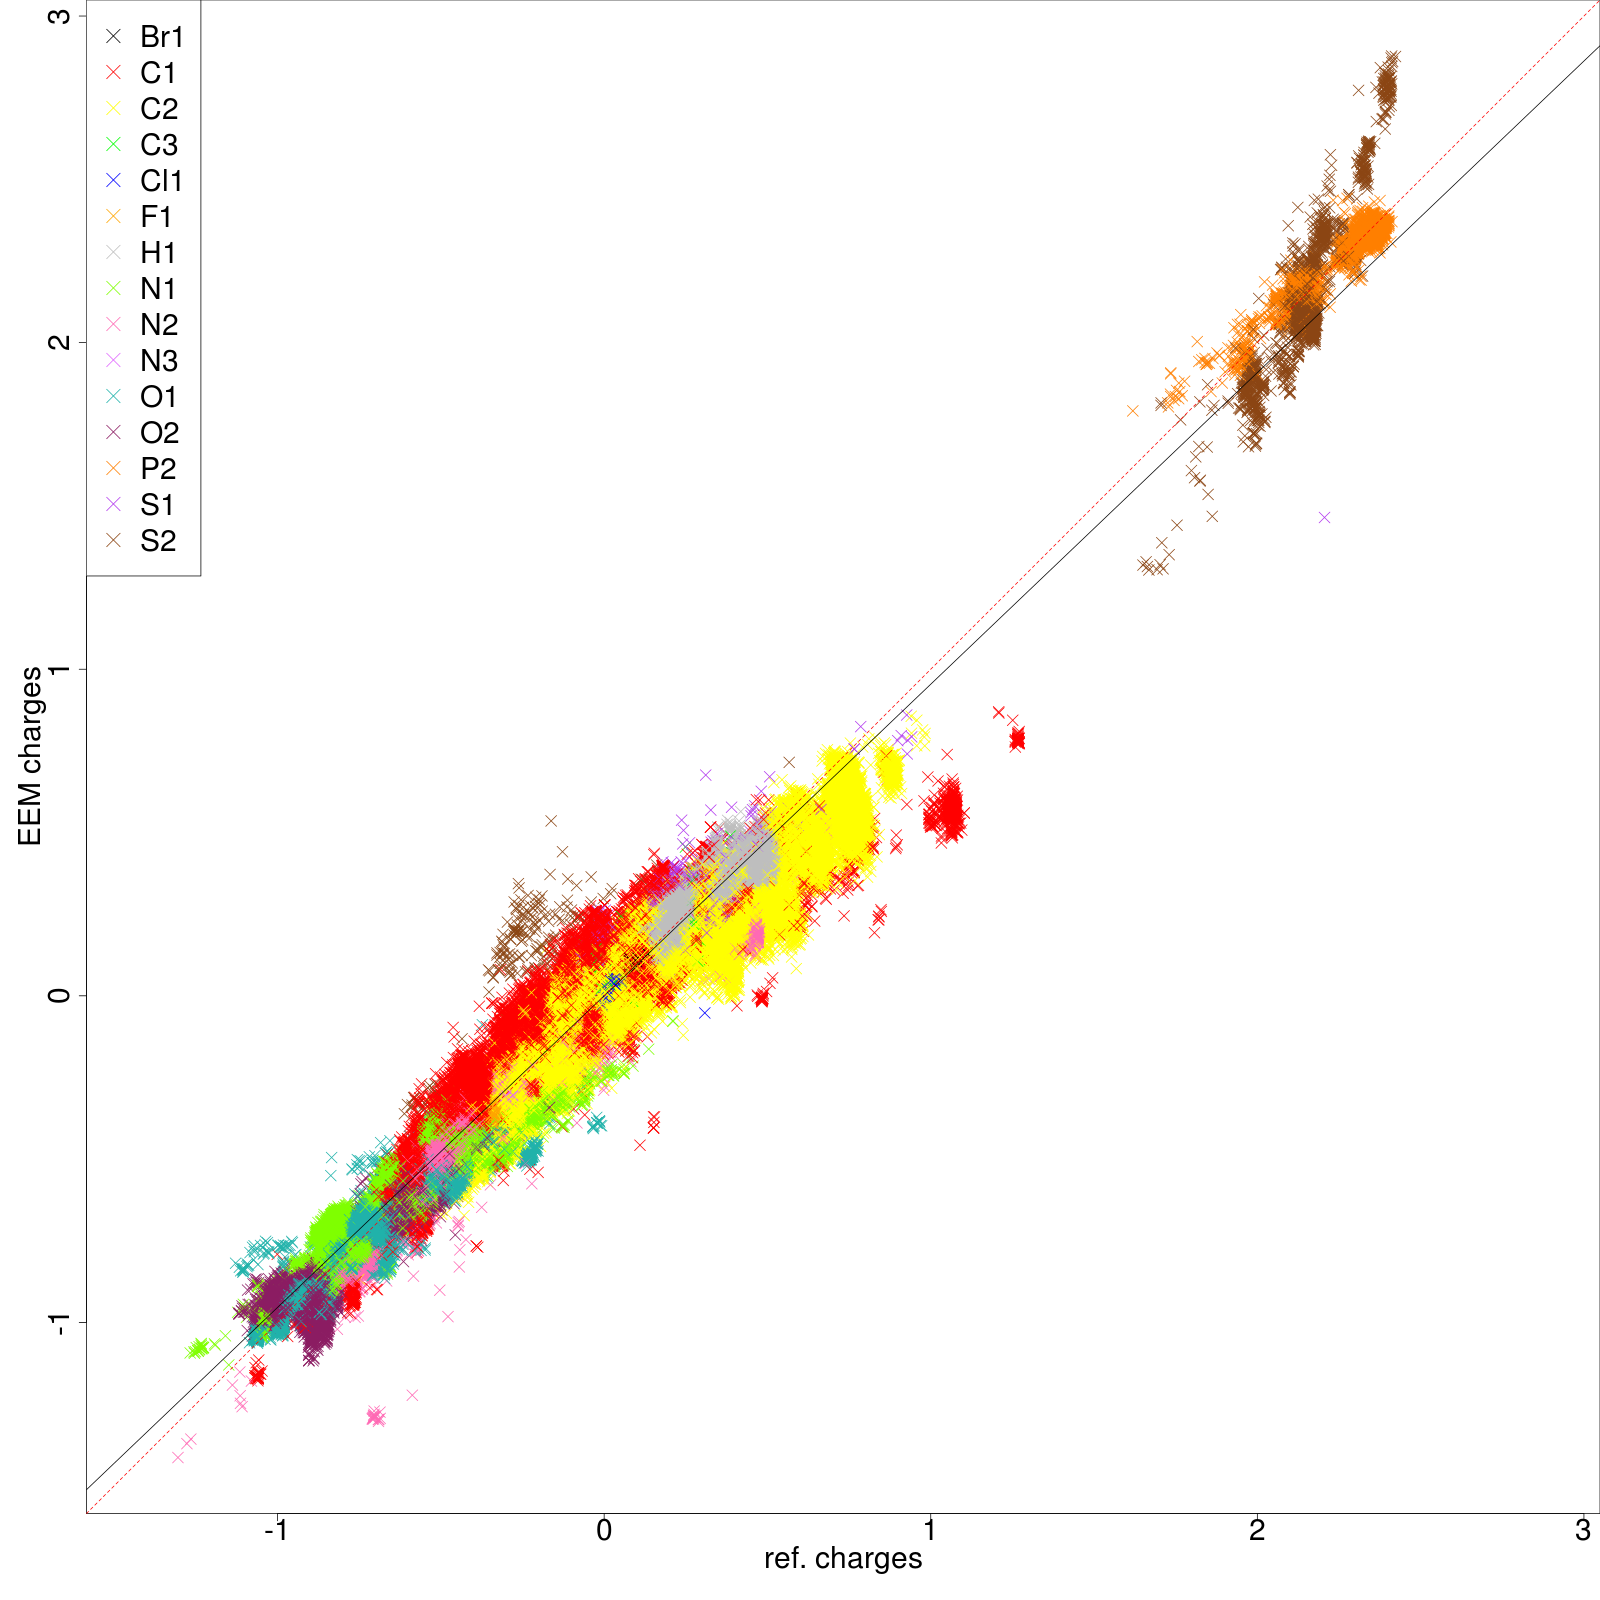
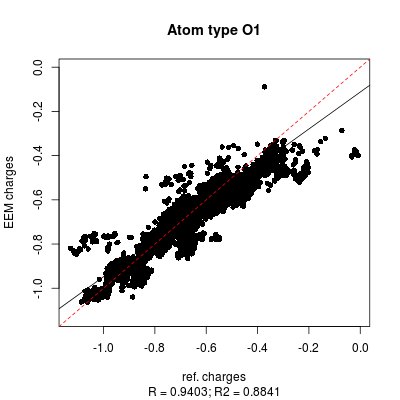
Figure 6 and 7 demonstrate as the correlation graphs include both all atom and individual atomic types dependency.

