NEEMP:Reports: Difference between revisions
No edit summary |
No edit summary |
||
| Line 29: | Line 29: | ||
* '''''csv''''' files containing per-atom charge information and values for several performance evaluating metrics for each atomic type and molecule | * '''''csv''''' files containing per-atom charge information and values for several performance evaluating metrics for each atomic type and molecule | ||
* '''''png''''' files displaying the charge correlation graphs for the whole set and for each atomic type | * '''''png''''' files displaying the charge correlation graphs for the whole set and for each atomic type | ||
* '''''html''''' file gathering together all the previous information in an interactive and more easily readable report page | * '''''html''''' file gathering together all the previous information in an interactive and more easily readable report page | ||
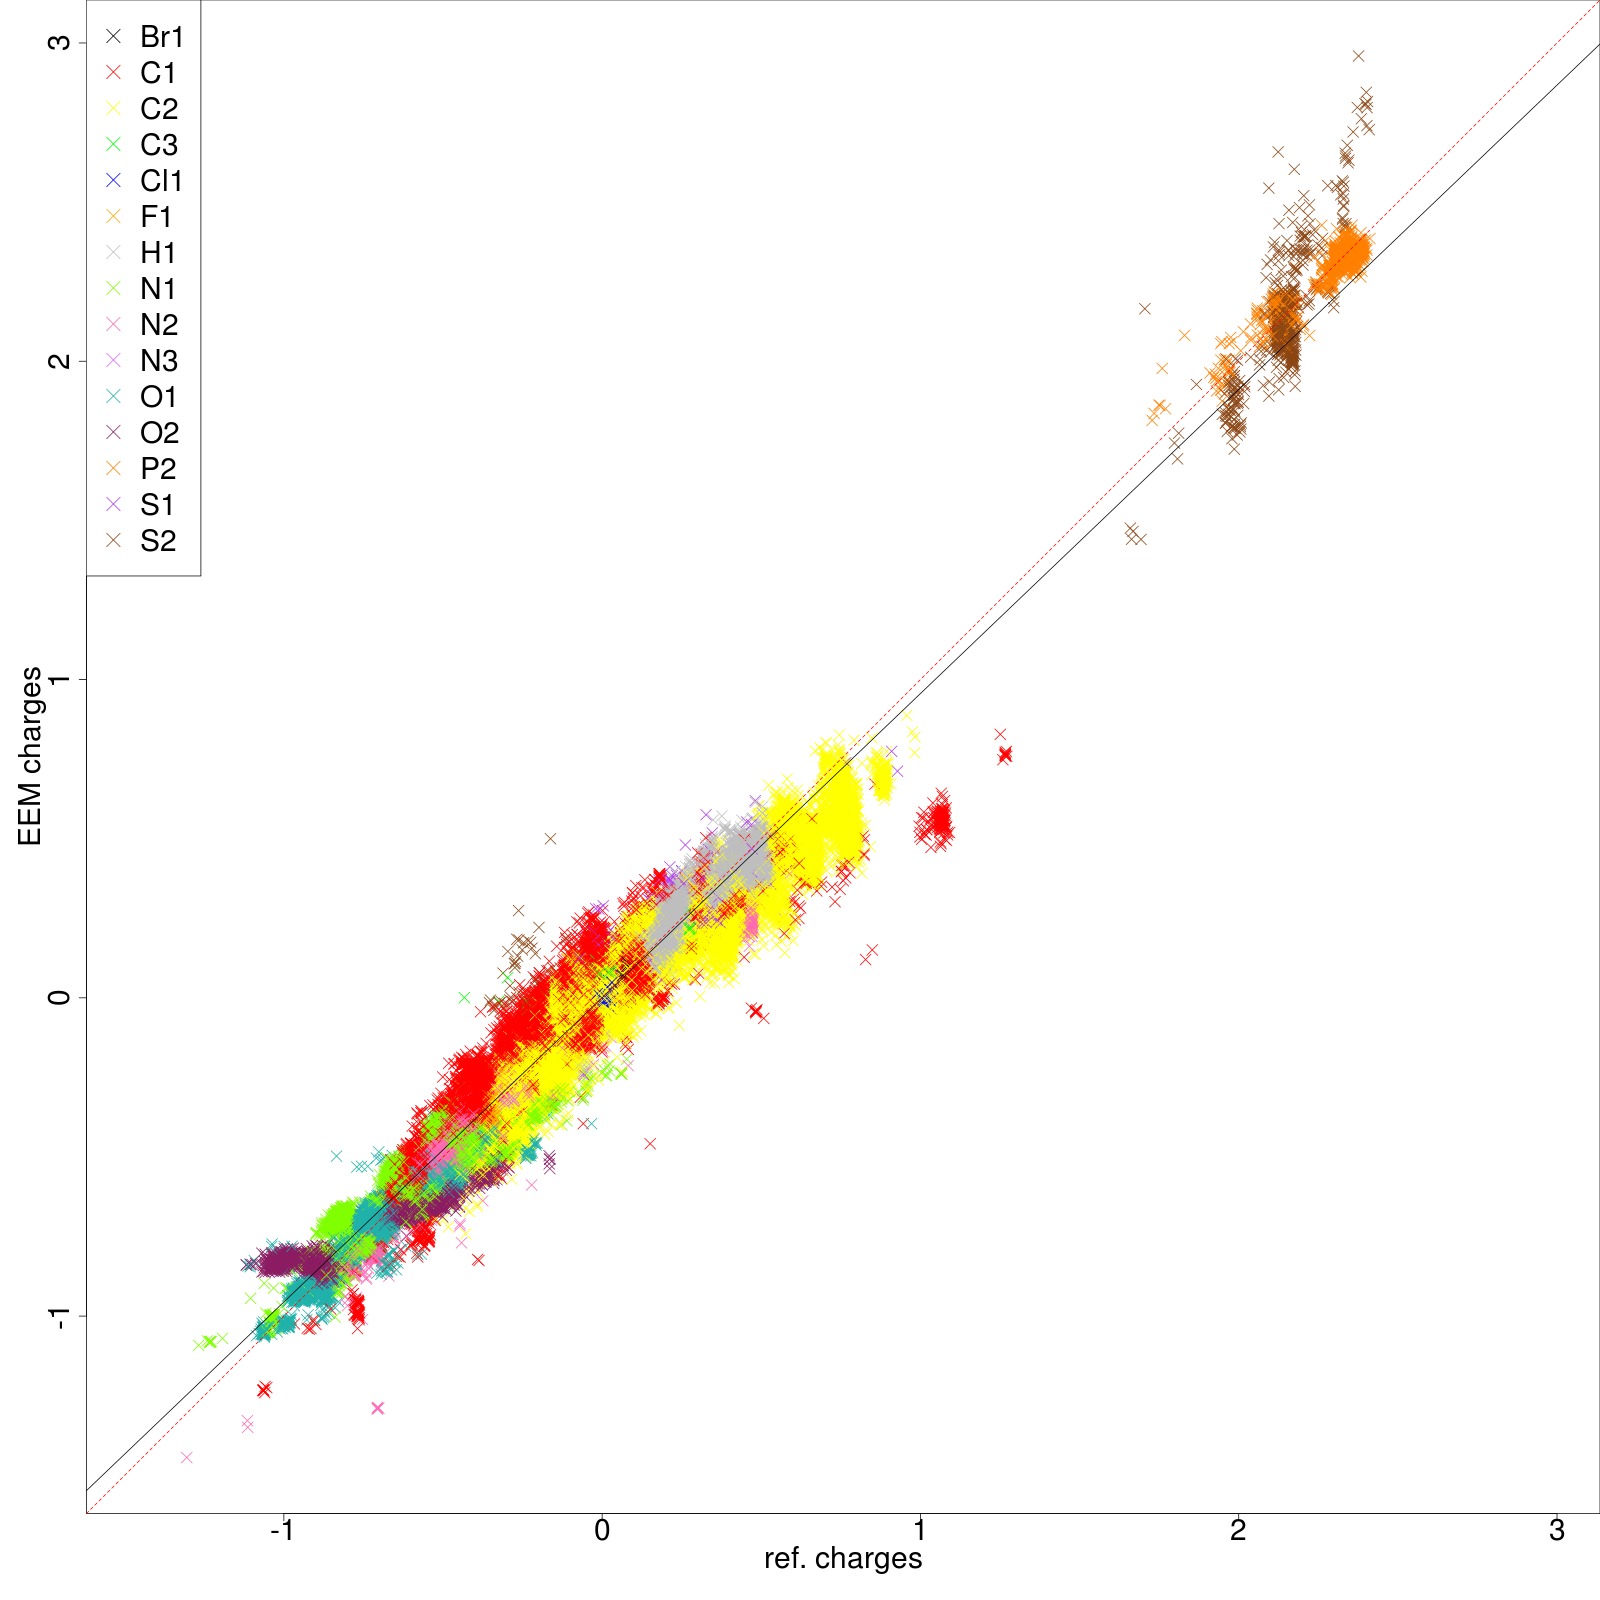
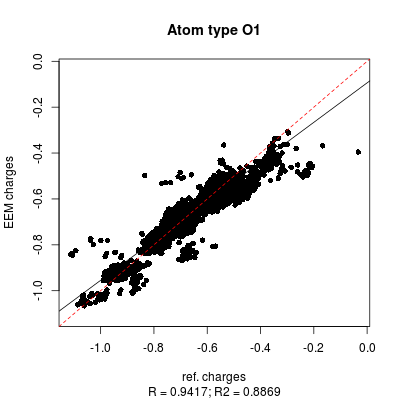
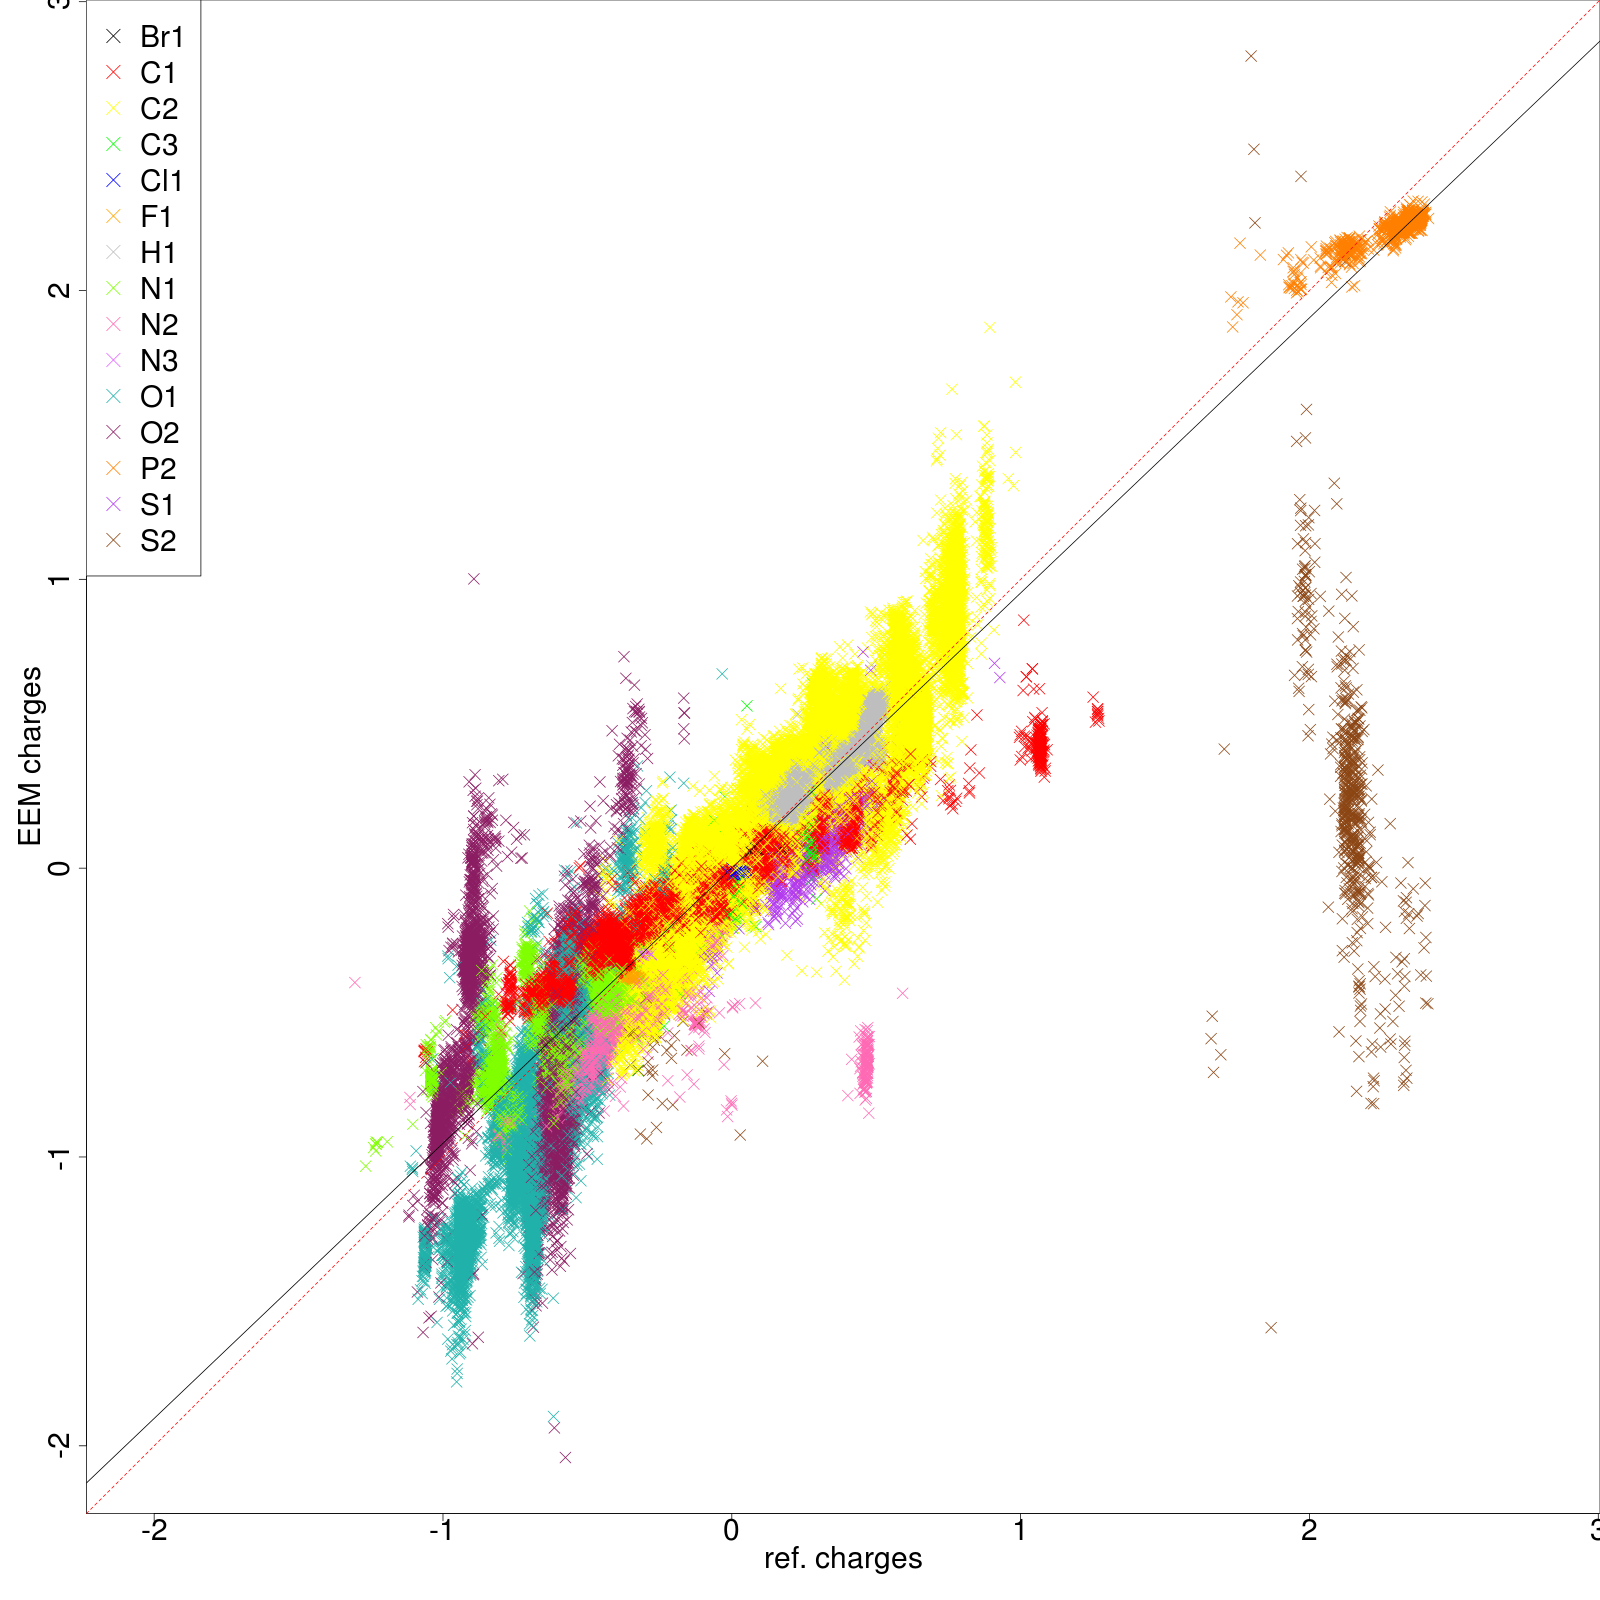
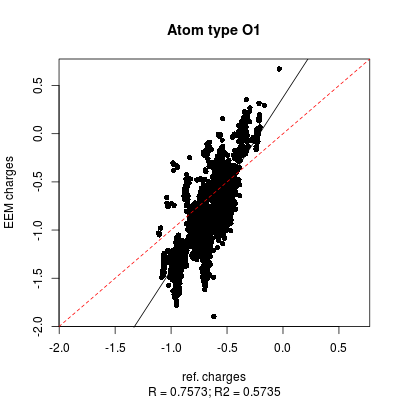
'''''Figure 6''''' and '''''Figure 7''''' compare few emblematic results extracted from the quality report files for two distinct '''NEEMP''' runs: the first evaluating a parameter set generated using the '''LR''' approach, meanwhile the second a parameter set generated using the '''DE-MIN''' approach. In both cases the training set is ''set02.sdf'' (for the full report click [[http://www.fi.muni.cz/~xracek/neemp/ here]). | |||
{| class="wikitable" border="1" style="margin-left: auto; margin-right: auto;" width="650px" | {| class="wikitable" border="1" style="margin-left: auto; margin-right: auto;" width="650px" | ||
Revision as of 16:25, 29 June 2016
Along with NEEMP we provide an handy python script to generate charge correlation graphs and quality assay reports, named nut-report.py.
SCRIPT BASIC USAGE:
Step 1:
- Generation of chg-stats-out-file in which for each atom the difference between the reference QM charge and the EEM charge is calculated (figure 5). Such a file can be obtained running NEEMP in quality validation mode with the option
--chg-stats-out-file(see example or quality validation for details).
Step 2:
- Call nut-report.py with the above-mentioned file
./nut-report.py chg-stats-out-file
Requirements:
- Python (https://www.python.org/)
NB: the script has been tested for both Python 2.7 and Python 3.4, as well as for R 3.2.

.
Once the script has been executed, a bunch of output files are generated in the chg-stats-out-file directory. In particular:
- csv files containing per-atom charge information and values for several performance evaluating metrics for each atomic type and molecule
- png files displaying the charge correlation graphs for the whole set and for each atomic type
- html file gathering together all the previous information in an interactive and more easily readable report page
Figure 6 and Figure 7 compare few emblematic results extracted from the quality report files for two distinct NEEMP runs: the first evaluating a parameter set generated using the LR approach, meanwhile the second a parameter set generated using the DE-MIN approach. In both cases the training set is set02.sdf (for the full report click [here).

|
 
|
| Figure 6: All atom correlation graph between QM charges (x axis) and EEM charges (y axis). | |

|
 
|
| Figure 7: | |